Glossary Glossary · Costs & break-even · Updated 7 Jul 2026

What is break-even point?

The break-even point is the revenue (or unit count) at which total revenue exactly matches total costs — the point where your shop stops losing money for the day and starts earning it.

Break-even point — the short answer

The break-even point is the revenue (or unit count) at which total revenue exactly matches total costs — the point where your shop stops losing money for the day and starts earning it.

Break-even point is the revenue level — or the unit count — at which your total revenue equals your total costs for the period. Below it, you are losing money. Above it, every additional euro of contribution drops to EBIT. The formula is straightforward: Break-even units = Fixed costs ÷ (Average selling price − Average variable cost per unit). nouz turns the abstract formula into a daily revenue target you can actually hit before close.

TL;DR

The line where loss becomes profit. Break-even units = Fixed costs / (Price − Variable cost per unit). Break-even revenue = Fixed costs / Contribution margin %. Below break-even you are paying out of savings; above it, every euro of contribution is EBIT. Compute it monthly, then divide by trading days to get a daily revenue target.

Definition, in shop-owner English

Every sale you make has two cost types attached to it. Variable costs scale with the sale — ingredients, packaging, card fees, the cost of the product itself. Fixed costs do not — rent, insurance, salaries, software subscriptions. Fixed costs are owed whether you serve one customer or one thousand.

Break-even is the point where the contribution from your sales (price minus variable cost) has covered every euro of fixed cost for the period. One euro before break-even, you are still in the red. One euro after, you are in the black. The metric is not a target — it is a floor. Everything above break-even is the actual business.

You can express it in units (how many haircuts, coffees, or jumpers must I sell?) or in revenue (how much money has to come through the till?). Both answer the same question from different angles.

The formula and a worked example

Break-even formulas. Break-even units = Fixed costs / (Price − Variable cost per unit). Break-even revenue = Fixed costs / Contribution margin %. Daily break-even revenue = Monthly break-even revenue / Trading days in the month.
Break-even units    = Fixed costs / (Price - Variable cost per unit)
Break-even revenue  = Fixed costs / Contribution margin %

Contribution margin % = (Price - Variable cost) / Price

A Vienna cafe with €8.400 of monthly fixed costs (rent, insurance, manager salary, software, utilities). Average ticket €4,80. Average variable cost per ticket (coffee, milk, cup, card fee) €1,44. Contribution per ticket = €3,36. Contribution margin = 70%.

StepCalculationResult
Monthly fixed cost€8.400
Contribution per ticket€4,80 − €1,44€3,36
Break-even tickets (month)8.400 / 3,362.500 tickets
Break-even revenue (month)2.500 × 4,80€12.000
Trading days26
Daily break-even revenue12.000 / 26€461,54
Daily break-even tickets2.500 / 2696 tickets

The cafe needs 96 paying tickets a day before EBIT turns positive. Ticket 97 contributes €3,36 to profit. Ticket 150 contributes €3,36 to profit. The contribution stays flat per unit; the leverage comes from running well past break-even.

Daily break-even targets by sector

Break-even varies wildly by fixed-cost load and contribution margin. The bands below are rough monthly fixed-cost ranges for a single-location owner-operated shop.

SectorTypical monthly fixed costTypical contribution marginMonthly break-even revenue
Cafe (single location)€6.000 - €10.00065 - 72%€9.000 - €15.000
Salon (3-4 chairs)€5.000 - €9.00078 - 85%€6.500 - €11.500
Boutique retail€4.000 - €8.00045 - 55%€8.500 - €17.500
Small e-commerce€2.500 - €6.00040 - 55%€5.500 - €14.000
Restaurant (30 covers)€12.000 - €20.00060 - 68%€19.000 - €32.000

The right number for your shop is the one computed from your fixed costs and your contribution margin — not an industry average. Run the formula on your own figures monthly. The interesting number is not the absolute total; it is whether the gap between actual revenue and break-even is widening or narrowing.

Why it matters for daily P&L

Break-even converts abstract fixed costs into a daily revenue target you can hit or miss. A cafe owner who sees "€461 today" on their phone and looks at "€380 in the till" knows immediately the day was loss-making — without doing any math. The same owner who only sees a monthly P&L learns three weeks later, after eleven loss days have stacked up.

Used in the other direction, break-even is the planning floor for every cost decision. A €600/month rent increase shifts daily break-even by €23 in the cafe example. That tells you whether the new lease is workable before you sign it.

For the deeper version, including margin of safety and the relationship to contribution margin, see break-even analysis for small business.

Common mistakes

Break-even is a simple formula, which is exactly why it is so easy to compute a number that feels precise and is quietly wrong. The five errors below account for almost every misleading break-even figure a small shop carries around.

  • Leaving the owner's wage out of fixed costs. A break-even that excludes owner pay describes a shop that only "breaks even" because the person running it works for free. Add a market-rate salary to the fixed-cost stack or the whole figure is fiction.
  • Using gross revenue or gross margin instead of net. The contribution margin in the denominator must be built on net revenue — after VAT and card fees. Compute it on gross and the margin looks 15-25% fatter than reality, so break-even comes out far too low.
  • Treating break-even as a target. Break-even is a floor, not a goal. A shop that aims to hit break-even is aiming to make zero profit. The target sits above it — break-even plus the EBIT you actually need to bank.
  • Forgetting to divide by trading days. A monthly break-even of €12.000 tells you nothing at 4pm on a Tuesday. Divide by trading days first, then compare the daily target against the till. Comparing a monthly number to a single day's takings is the most common panic-or-complacency trap.
  • Never re-running it after a cost change. A rent rise, a new hire, a supplier price increase — each one moves break-even. A figure computed once and taped to the wall drifts out of date within a quarter. Recompute whenever a fixed cost or contribution margin changes.

How it shows up in your daily P&L

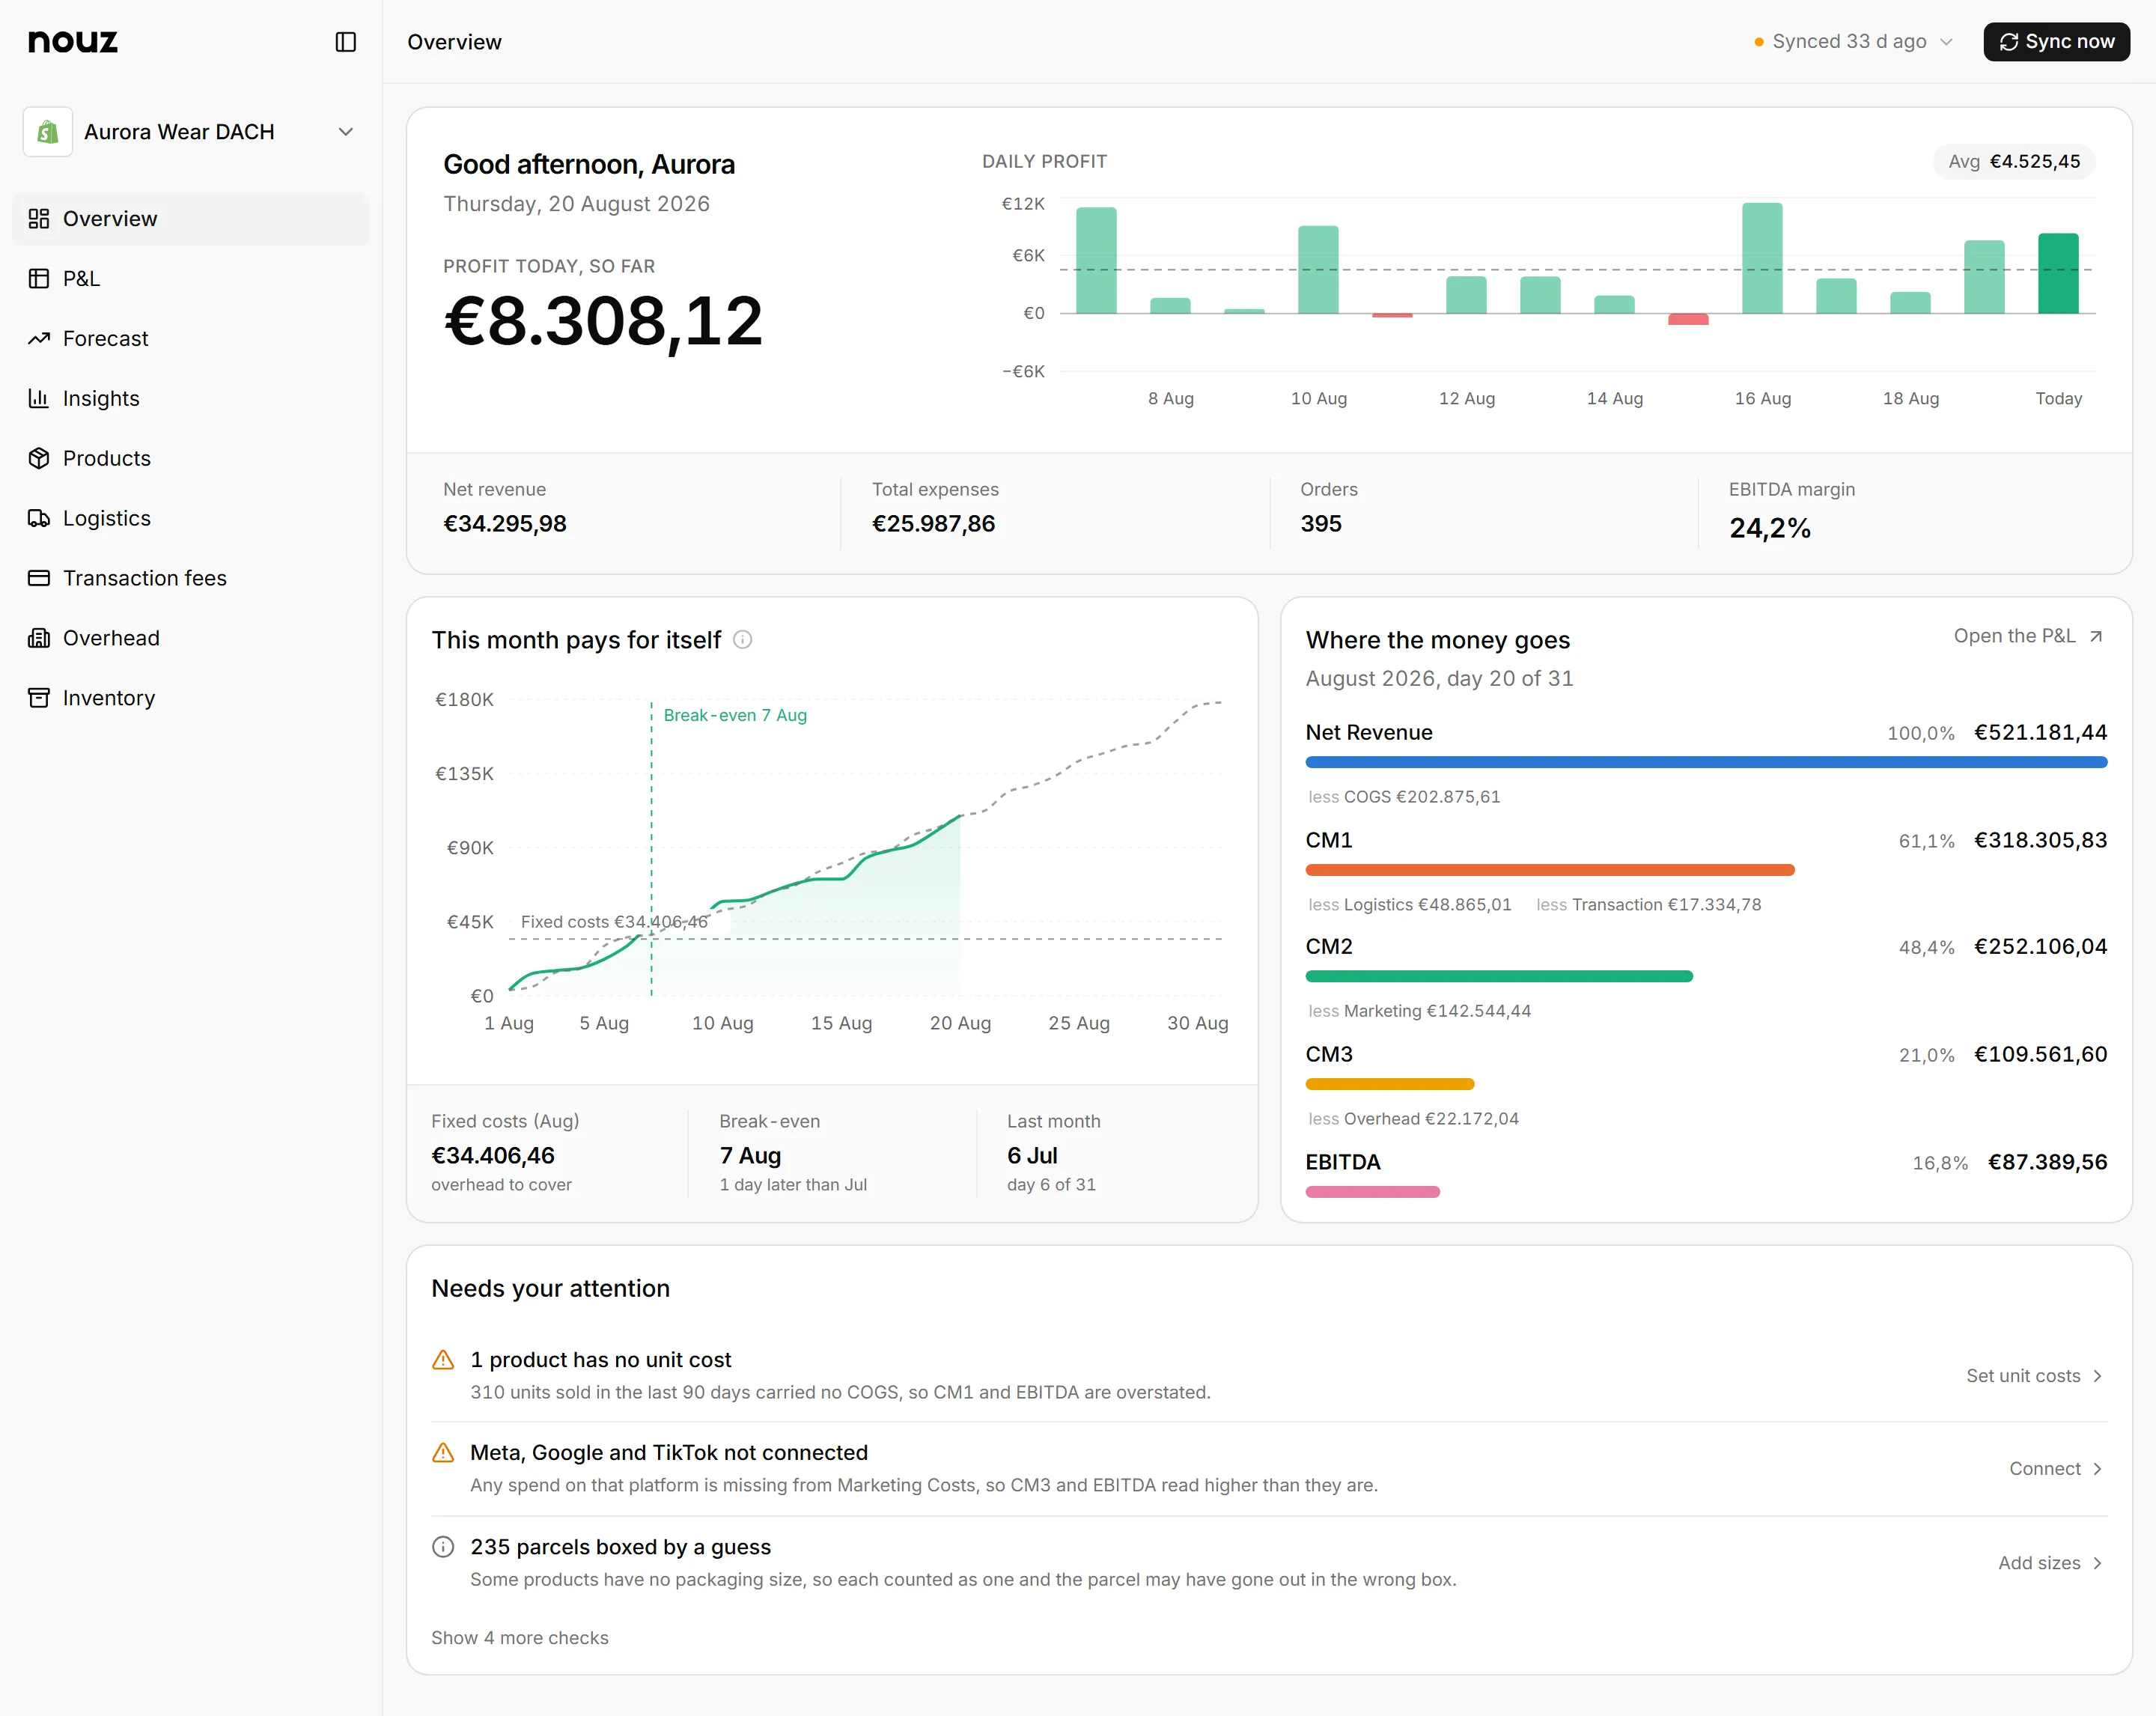
Break-even is only useful if you can see it against today, not against a spreadsheet you open once a month. In nouz, every day is built the same way: gross revenue minus tax minus card fees gives net revenue; net revenue minus COGS minus variable costs minus the day's slice of fixed cost gives EBIT. That daily fixed-cost slice is your monthly fixed stack divided across trading days — the exact same number that sits under the break-even formula.

So the daily break-even target is not a separate calculation you run on the side; it is baked into the EBIT line you already read every evening. When the day's net revenue clears COGS, variable costs and the fixed slice, EBIT is positive and you finished above break-even. When it doesn't, EBIT is negative and you know before you lock up — not three weeks later when eleven quiet days have already stacked into a loss. The point of a same-day P&L is to make break-even a line you cross, or don't, in real time.

Seen across a month, the running gap between takings and the daily break-even target is the single most useful trend a shop owner can watch. A gap that widens day after day is the early signal to act — a price nudge, a cost trim, a busier promotion — while the month can still be saved. A gap that narrows tells you the last change worked. Either way, the number to watch is not the absolute total but the direction of the gap, and a same-day P&L is what makes that direction visible while there is still time to change it.

Related concepts

See your daily break-even on your phone. nouz takes your fixed costs and contribution margin and shows today's revenue against today's break-even — by close of day, before the loss stacks up.

Common questions

What is the break-even point for a small business?

Break-even is the revenue (or unit count) at which total revenue equals total costs. Below it, you are losing money for the period. The formula: Break-even units = Fixed costs / (Price − Variable cost per unit). Compute monthly, then divide by trading days for a daily revenue floor.

How do I calculate daily break-even revenue?

Take monthly fixed costs, divide by your contribution margin percentage to get monthly break-even revenue, then divide by the number of trading days in the month. A cafe with €8.400 fixed costs and 70% contribution margin needs €12.000/month, or roughly €462/day across 26 trading days.

Does break-even include the owner's salary?

It should, if the owner is taking a market-rate wage. A break-even number that excludes owner pay describes a shop that "breaks even" only because the owner is working for free. Add a realistic owner salary to fixed costs to get the honest figure. See what fixed costs actually mean for the full list.

Is break-even the same as profit target?

No. Break-even is the floor — the point where loss becomes zero. A profit target sits above break-even by the amount of EBIT you want to bank. If you need €3.000/month of profit and contribution margin is 70%, your revenue target is break-even revenue plus €3.000 ÷ 0,70 = break-even plus €4.286.

Break-even in units or in revenue — which should I use?

Use whichever you can act on. Units answer "how many coffees / haircuts / jumpers must I sell?" and suit a shop with a tight product range and a stable ticket. Revenue answers "how much has to come through the till?" and suits a mixed-basket shop where the average ticket wanders. Both are the same break-even seen from different angles; nouz shows the revenue version by default because a till total is the number a shop owner reads fastest.

How often should I recalculate my break-even?

Recompute it whenever a fixed cost or your contribution margin changes — a rent rise, a new hire, a supplier price increase, a menu re-price. In practice that means reviewing it monthly and re-running it the moment any structural cost moves. A break-even figure calculated once and left alone drifts out of date within a quarter.

Why is my break-even so high even though my margins look good?

High break-even with healthy margins almost always means the fixed-cost stack is heavy relative to the shop's size — a rich lease, too much payroll for the revenue, or subscriptions that crept up. Contribution margin sets how fast you climb toward break-even; fixed costs set how far away the line sits. If margins are strong but break-even feels unreachable, the problem is the denominator's neighbour: fixed costs, not margin.

Get started · 7-min setup

Stop looking up your break-even point after the fact.

nouz computes your break-even point — and the rest of your daily P&L — automatically, every night at close. Set up in 7 minutes; tonight's number lands on your phone before you lock up.

14 days free·No card at signup·Pay monthly·Cancel in two clicks