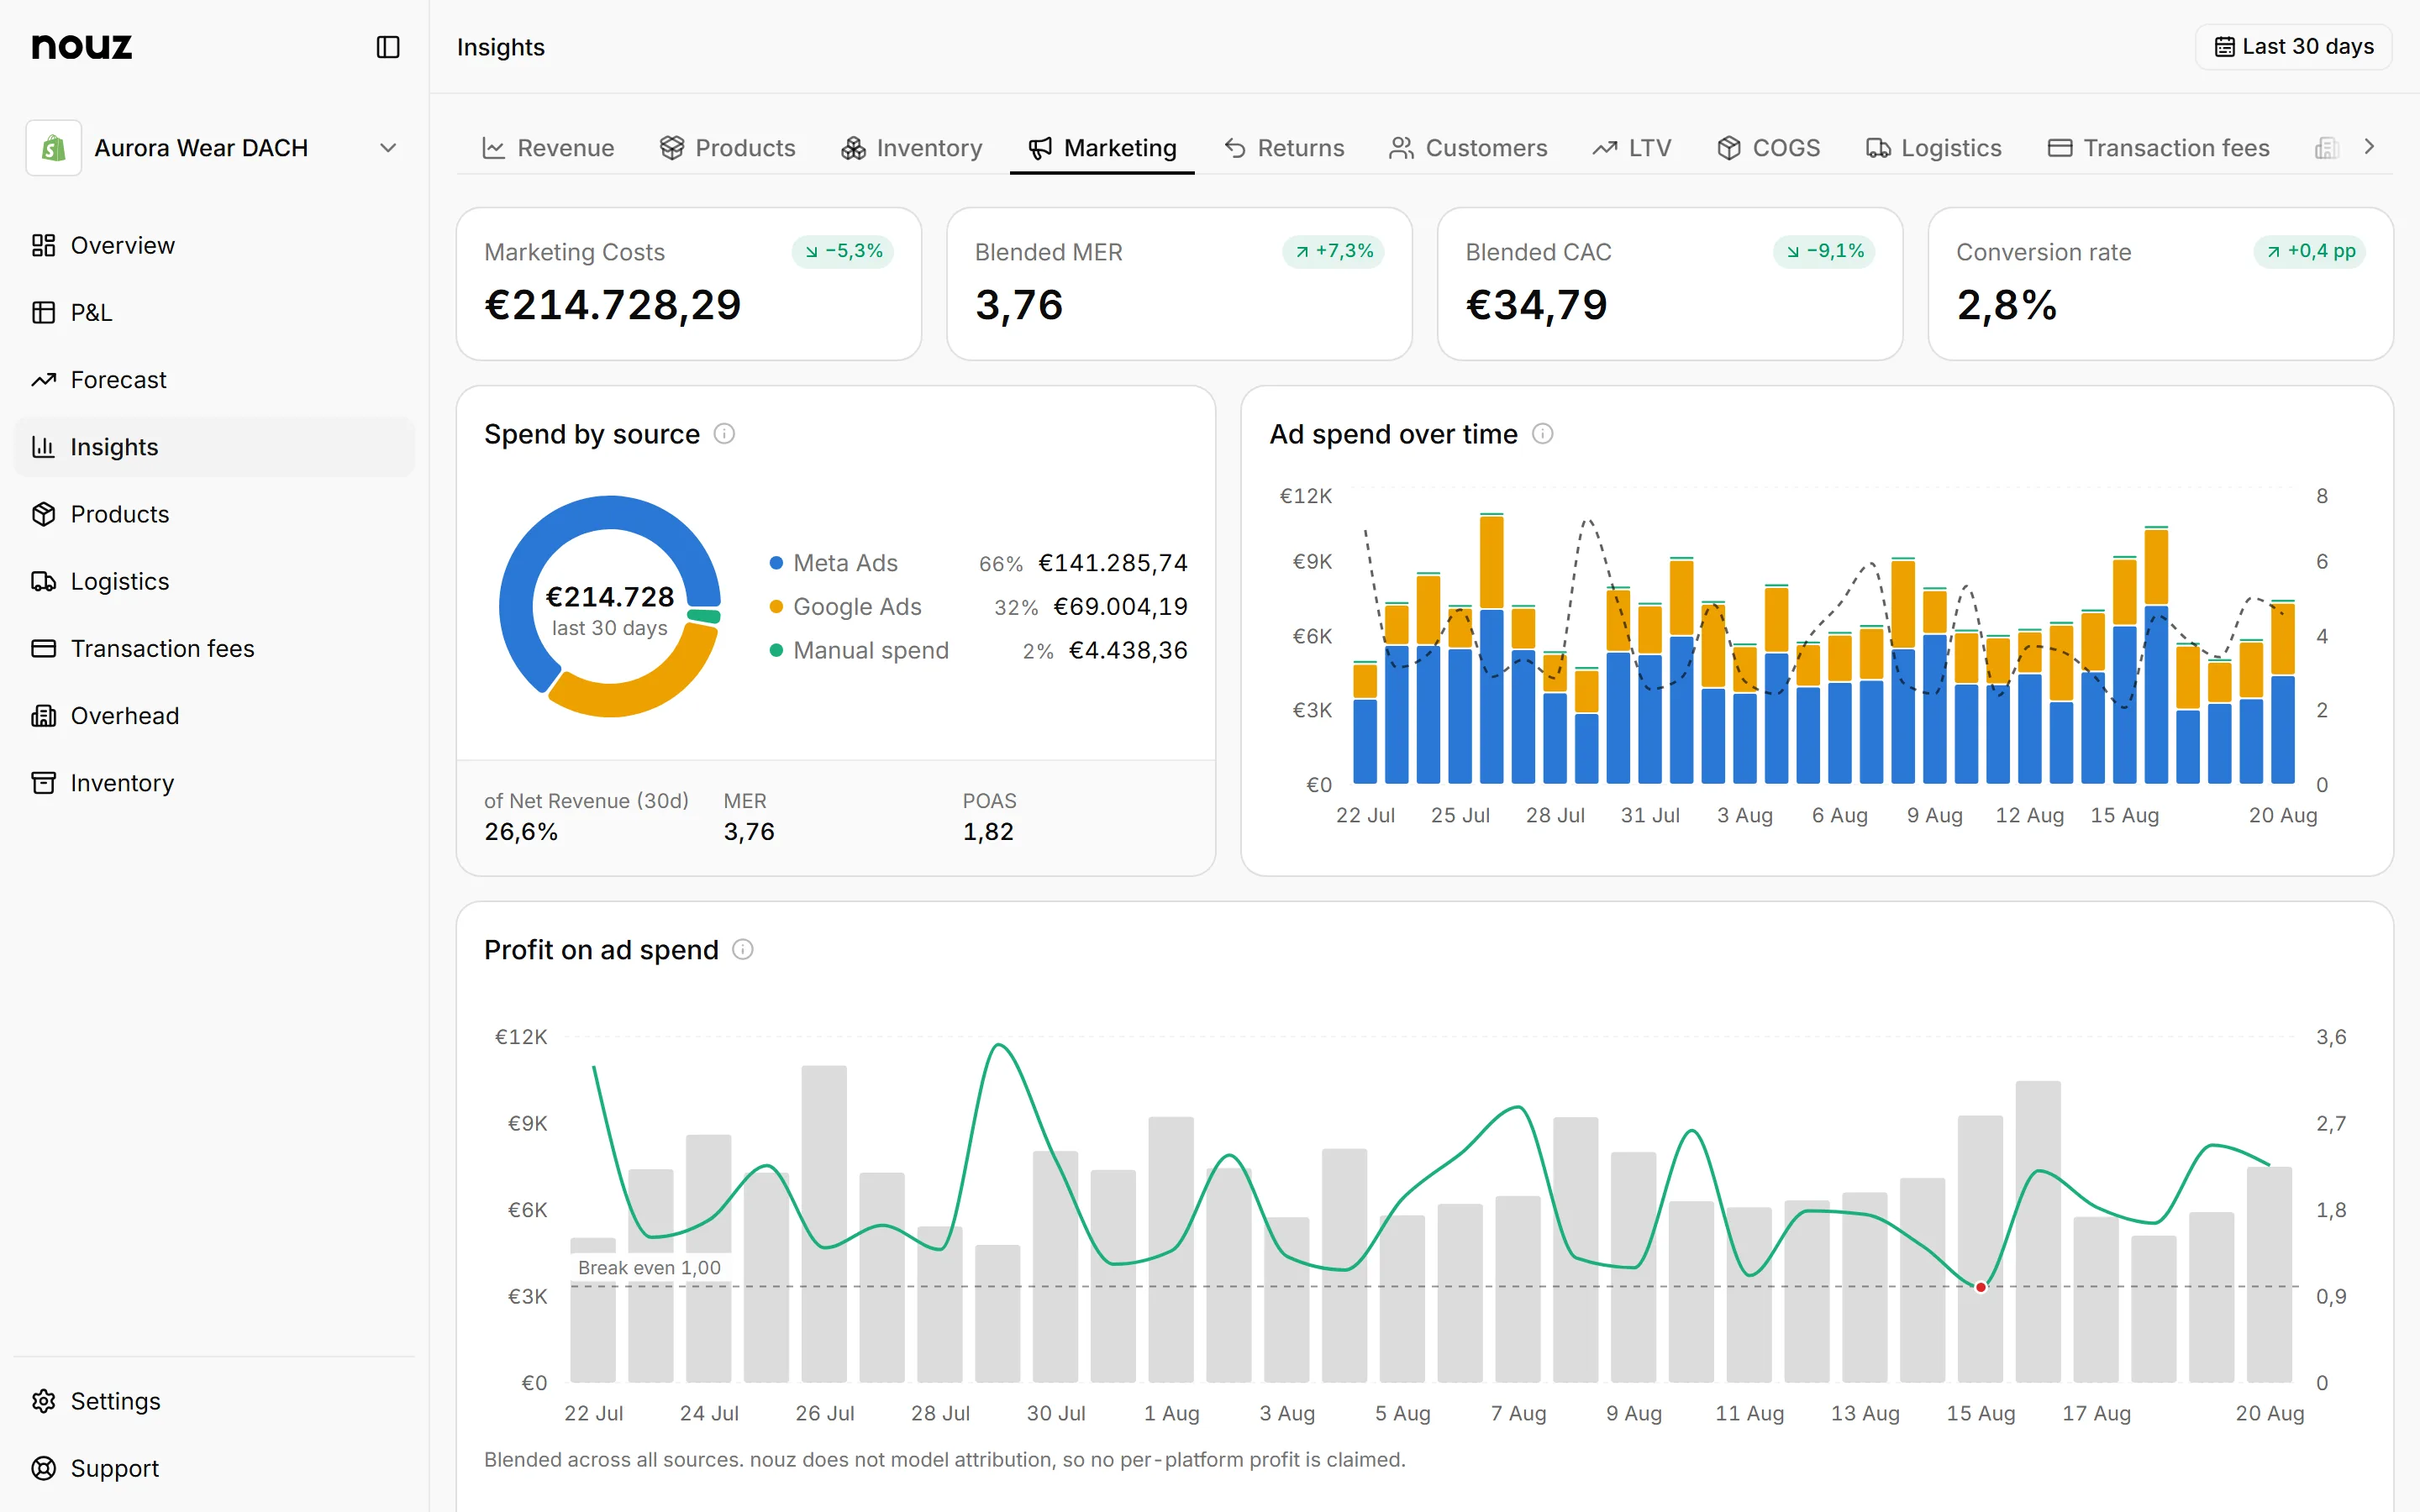
What is return on Ad Spend (ROAS)?
ROAS tells you how many euros of revenue every euro of ad spend produced — but the platform-reported version is almost always overstated.
Return on Ad Spend (ROAS) is the revenue generated by an advertising campaign divided by the cost of running that campaign. It is the headline metric every ad platform reports. It is also the metric most likely to lie to you — because the platform decides what counts as "attributed revenue" and the platform is the one being paid. nouz tracks blended ROAS (total revenue ÷ total ad spend) against your daily P&L, which removes the platform from the judging panel.
TL;DR
The definition, in shop-owner English
ROAS answers: for every euro I put into ads, how many euros came back as revenue? A 4x ROAS means €4 of revenue per €1 of spend. A 2x ROAS means €2. A 1x ROAS means break-even on revenue (which usually means a loss on profit, because revenue is not the same as gross profit).
The number sounds simple. The complication is in what counts as "revenue attributed to ads." Meta's default attribution gives credit to any purchase that happened within 7 days of a click on a Meta ad — even if the customer also clicked a Google ad, opened an email, and would have purchased anyway. Google does the same. Add the two platforms together and you can easily get "attributed revenue" that is 130% of your actual revenue. The math works for the platforms; it does not work for you.
The formula and the platform caveat
ROAS = Revenue attributed to ads ÷ Ad spend
For a single platform, this is the number the platform shows on its dashboard. For your business as a whole, the better formula is:
Blended ROAS = Total revenue ÷ Total ad spend (all channels combined)
Blended ROAS removes the attribution debate entirely. It does not care which channel got "credit" for a sale — it just divides what you sold by what you spent. If your blended ROAS is 4x and your platform-reported ROAS is 8x, the gap is exactly the over-attribution your platforms are claiming.
The three reasons platform ROAS overstates:
- Attribution windows. Default 7-day click / 1-day view windows credit purchases that would have happened anyway.
- View-through credit. A customer who saw an ad but did not click still counts if they purchase within the window.
- Brand cannibalization. Branded search ads steal credit from organic searches — the customer was already coming to you.
Worked example: 6x ROAS
A small DTC shop running Meta and Google in March:
| Line | Amount | Note |
|---|---|---|
| Ad spend (Meta + Google) | €3.000 | Combined budget |
| Attributed revenue (platforms) | €18.000 | Sum of platform-reported |
| Platform ROAS | 6,0x | €18.000 ÷ €3.000 |
| Total store revenue (Shopify) | €21.000 | All channels, including organic |
| Blended ROAS | 7,0x | €21.000 ÷ €3.000 |
In this case blended ROAS is actually higher than platform ROAS — meaning organic and other channels are contributing genuinely incremental revenue beyond what the ads claimed.
A more common pattern, especially for established brands with heavy branded search spend:
| Line | Amount | Note |
|---|---|---|
| Ad spend | €3.000 | |
| Attributed revenue (platforms) | €21.000 | Sum of platform-reported |
| Platform ROAS | 7,0x | |
| Total store revenue | €18.000 | Actual |
| Blended ROAS | 6,0x | €18.000 ÷ €3.000 |
Here platform ROAS overstates the truth by 17%. The platforms together claimed credit for €21.000 of revenue but the business only made €18.000 — the gap is double-counted sales and brand cannibalization. The honest ROAS is 6x, not 7x.
Benchmarks and break-even ROAS
A "good" ROAS depends entirely on your gross margin. Break-even ROAS is the number where ad spend exactly equals the gross profit it generated:
Break-even ROAS = 1 ÷ Gross margin %
A shop with 40% gross margin has a break-even ROAS of 2,5x — anything below means each ad euro produced less gross profit than it cost. A shop with 25% gross margin breaks even at 4x. A shop with 60% margin breaks even at 1,67x.
| Gross margin | Break-even ROAS | Healthy ROAS target |
|---|---|---|
| 25% | 4,0x | 6,0x or better |
| 40% | 2,5x | 4,0x or better |
| 50% | 2,0x | 3,0x or better |
| 60% | 1,67x | 2,5x or better |
| 70% | 1,43x | 2,0x or better |
A few rules of thumb worth keeping in your head. These are rough guides, not guarantees — the honest way to set your own break-even ROAS is your real gross margin, which you can test in the break-even ROAS calculator.
| Rule of thumb | Rough guide | Read |
|---|---|---|
| Break-even ROAS | = 1 ÷ gross margin % | The line below which each ad euro loses money. |
| Healthy target | ~1,5-2× break-even | Leaves room for fixed costs and returns after covering COGS. |
| Platform vs blended gap | Often 30-60% overstated | Platform ROAS routinely claims more revenue than the store actually made. |
| Summed platform ROAS | Can exceed 100% of revenue | A sure sign of double-counted, over-attributed sales. |
Common mistakes
- Treating platform ROAS as truth. Meta and Google both claim credit for the same customer. Summed, their reported revenue can exceed what the store actually made — the gap is over-attribution, not extra sales.
- Ignoring margin when judging ROAS. A 4x ROAS is healthy at 40% margin and exactly break-even at 25%. Without break-even ROAS (= 1 ÷ gross margin) in front of you, a "good" ROAS can be a quiet loss.
- Confusing ROAS with ROI. ROAS is revenue per ad euro; ROI is profit per ad euro. A 4x ROAS at 25% margin is a 0x ROI. Revenue is not profit.
- Scaling on branded-search ROAS. Ads on your own brand name post gorgeous ROAS by taking credit for customers who were already coming. Blended ROAS exposes how little of that is incremental.
- Chasing a higher ROAS target than the business needs. Pushing for 8x when 3x is profitable usually just starves growth — you leave scalable, profitable spend on the table.
- Judging a channel on ROAS alone. A prospecting channel that opens new audiences will always post a lower ROAS than retargeting, which harvests demand you already created. Killing the low-ROAS channel can quietly shrink the pipeline the high-ROAS one feeds on.
Why blended ROAS is harder to fool yourself with
Platform ROAS is the metric the platform optimises for and reports back. It is the number their account managers will use to justify a higher budget. It is also the number that has driven thousands of small ecommerce shops to scale acquisition into a loss they only discovered at year-end.
Blended ROAS cannot be inflated by attribution tricks. If your blended ROAS is dropping while your platform ROAS holds steady, the platforms are claiming credit for sales that would have happened anyway. If both drop together, your acquisition is genuinely getting more expensive. The blended number tells the truth either way.
How it shows up in your daily P&L
ROAS is a revenue ratio; profit is what actually pays the rent. The cleanest reconciliation of the two is your daily EBIT. On a day you spent heavily on ads, a healthy blended ROAS should show up as a positive EBIT line once COGS, fees and that ad spend are all counted. When platform ROAS looks great but EBIT stays flat, that is the over-attribution gap made concrete — the revenue the platforms claimed did not survive to the bottom line. nouz gives you that same-day EBIT so you can see whether an ad-heavy day actually earned its spend back.
Related concepts:
- The ecommerce attribution window myth — why platform-reported ROAS overstates.
- The Shopify profitability guide — how ROAS fits into a daily P&L.
- Customer Lifetime Value — the other side of the acquisition equation.
Common questions
Is a 4x ROAS good?
Depends on your gross margin. At 40% margin, 4x is healthy — you generate roughly €1,60 of gross profit per €1 of ad spend before other costs. At 25% margin, 4x is exactly break-even and you make no profit on the marginal ad euro. Always pair ROAS with break-even ROAS (= 1 ÷ gross margin %) before judging it.
What is the difference between ROAS and ROI?
ROAS is revenue ÷ ad spend. ROI (return on investment) is profit ÷ ad spend. ROI is the honest profitability measure — ROAS is a proxy that ignores COGS, fees, and fulfillment. A 4x ROAS at 25% margin is a 0x ROI (break-even). Always translate ROAS to gross profit before treating it as a "return."
Should I use last-click or first-click attribution for ROAS?
Neither is honest in isolation. Use blended ROAS (total revenue ÷ total ad spend across all channels) as your primary number. Channel-specific attribution is useful for budget allocation between channels, but blended is the only one that cannot be inflated by attribution rules.
Why do my platform ROAS numbers add up to more than my actual revenue?
Because Meta and Google both claim credit for the same sales when a customer interacts with both. Meta's 7-day click attribution and Google's view-through credit overlap on most converting customers. Sum the two platforms and you commonly get 110-140% of real revenue. Blended ROAS solves this.
What is break-even ROAS?
Break-even ROAS is 1 ÷ your gross margin %. It is the ROAS at which the gross profit from ad-driven sales exactly equals the ad spend. At 40% margin, break-even ROAS is 2,5x; at 25% margin it is 4x. Anything below your break-even ROAS means each ad euro produced less gross profit than it cost — a loss before you even count fixed costs.
How do I calculate blended ROAS?
Blended ROAS = total store revenue across all channels ÷ total ad spend across all channels. It deliberately ignores which channel got credit for each sale, so it cannot be inflated by attribution windows or view-through claims. If blended ROAS is 4x and your summed platform ROAS is 8x, the platforms are over-claiming by half.
Does nouz track ROAS for me?
No. nouz is a simple daily profit tool, not an attribution suite — it does not pull spend or conversions from ad platforms and does not compute ROAS. You calculate ROAS from Meta, Google and your store data. What nouz shows is the same-day EBIT after ad spend, COGS and fees, so you can see whether a strong-looking ROAS actually turned into profit.