Planning a month
Monthly break-even worksheet
How much you have to sell before the month pays for itself.
7 columnsCSV
Any Shopify store
What this file is
A daily P&L tracker is a spreadsheet with one row per day and one column per cost, running from gross revenue down to EBITDA. Filling it in every morning shows which costs move with sales and which do not, and how much of yesterday's revenue you actually kept.
What is inside
The whole statement as a spreadsheet: one row per day with every cost in its own column, in the same order nouz computes them. Useful on its own, and the fastest way to see how much of this you are currently guessing.
Rows 1 and 2 are the file. Click any cell to read it; the foot of the sheet says what its column is for.
| Row | A | B | C | D | E | F | G | H | I | J | K | L | M | N | O | P |
|---|---|---|---|---|---|---|---|---|---|---|---|---|---|---|---|---|
| 1 | date | gross_revenue | discounts | returns | vat | net_revenue | cogs | cm1 | logistics | transaction_fees | cm2 | marketing | cm3 | overhead_daily | ebitda | |
| 2 | 2026-08-20 | 40607.66 | 1207.34 | 688.23 | 5623.45 | 34295.98 | 13112.01 | 21183.97 | 3184.63 | 1090.13 | 16909.21 | 7488.86 | 9420.35 | 1112.23 | 8308.12 | |
| 3 | ||||||||||||||||
| 4 | ||||||||||||||||
| 5 | ||||||||||||||||
| 6 | ||||||||||||||||
| 7 |
A · dateThe trading day, ISO formatted so the file sorts itself.
In the order they sit in the file. Point at one and it is outlined in the sheet.
Behind the file
The columns follow the same order nouz computes them in: revenue first, then each cost in the order it is taken out, with the margins CM1, CM2 and CM3 plus EBITDA where they belong. That order is the point of the file. A spreadsheet that lists costs alphabetically can tell you what you spent, but never which stage of the business ate the margin.
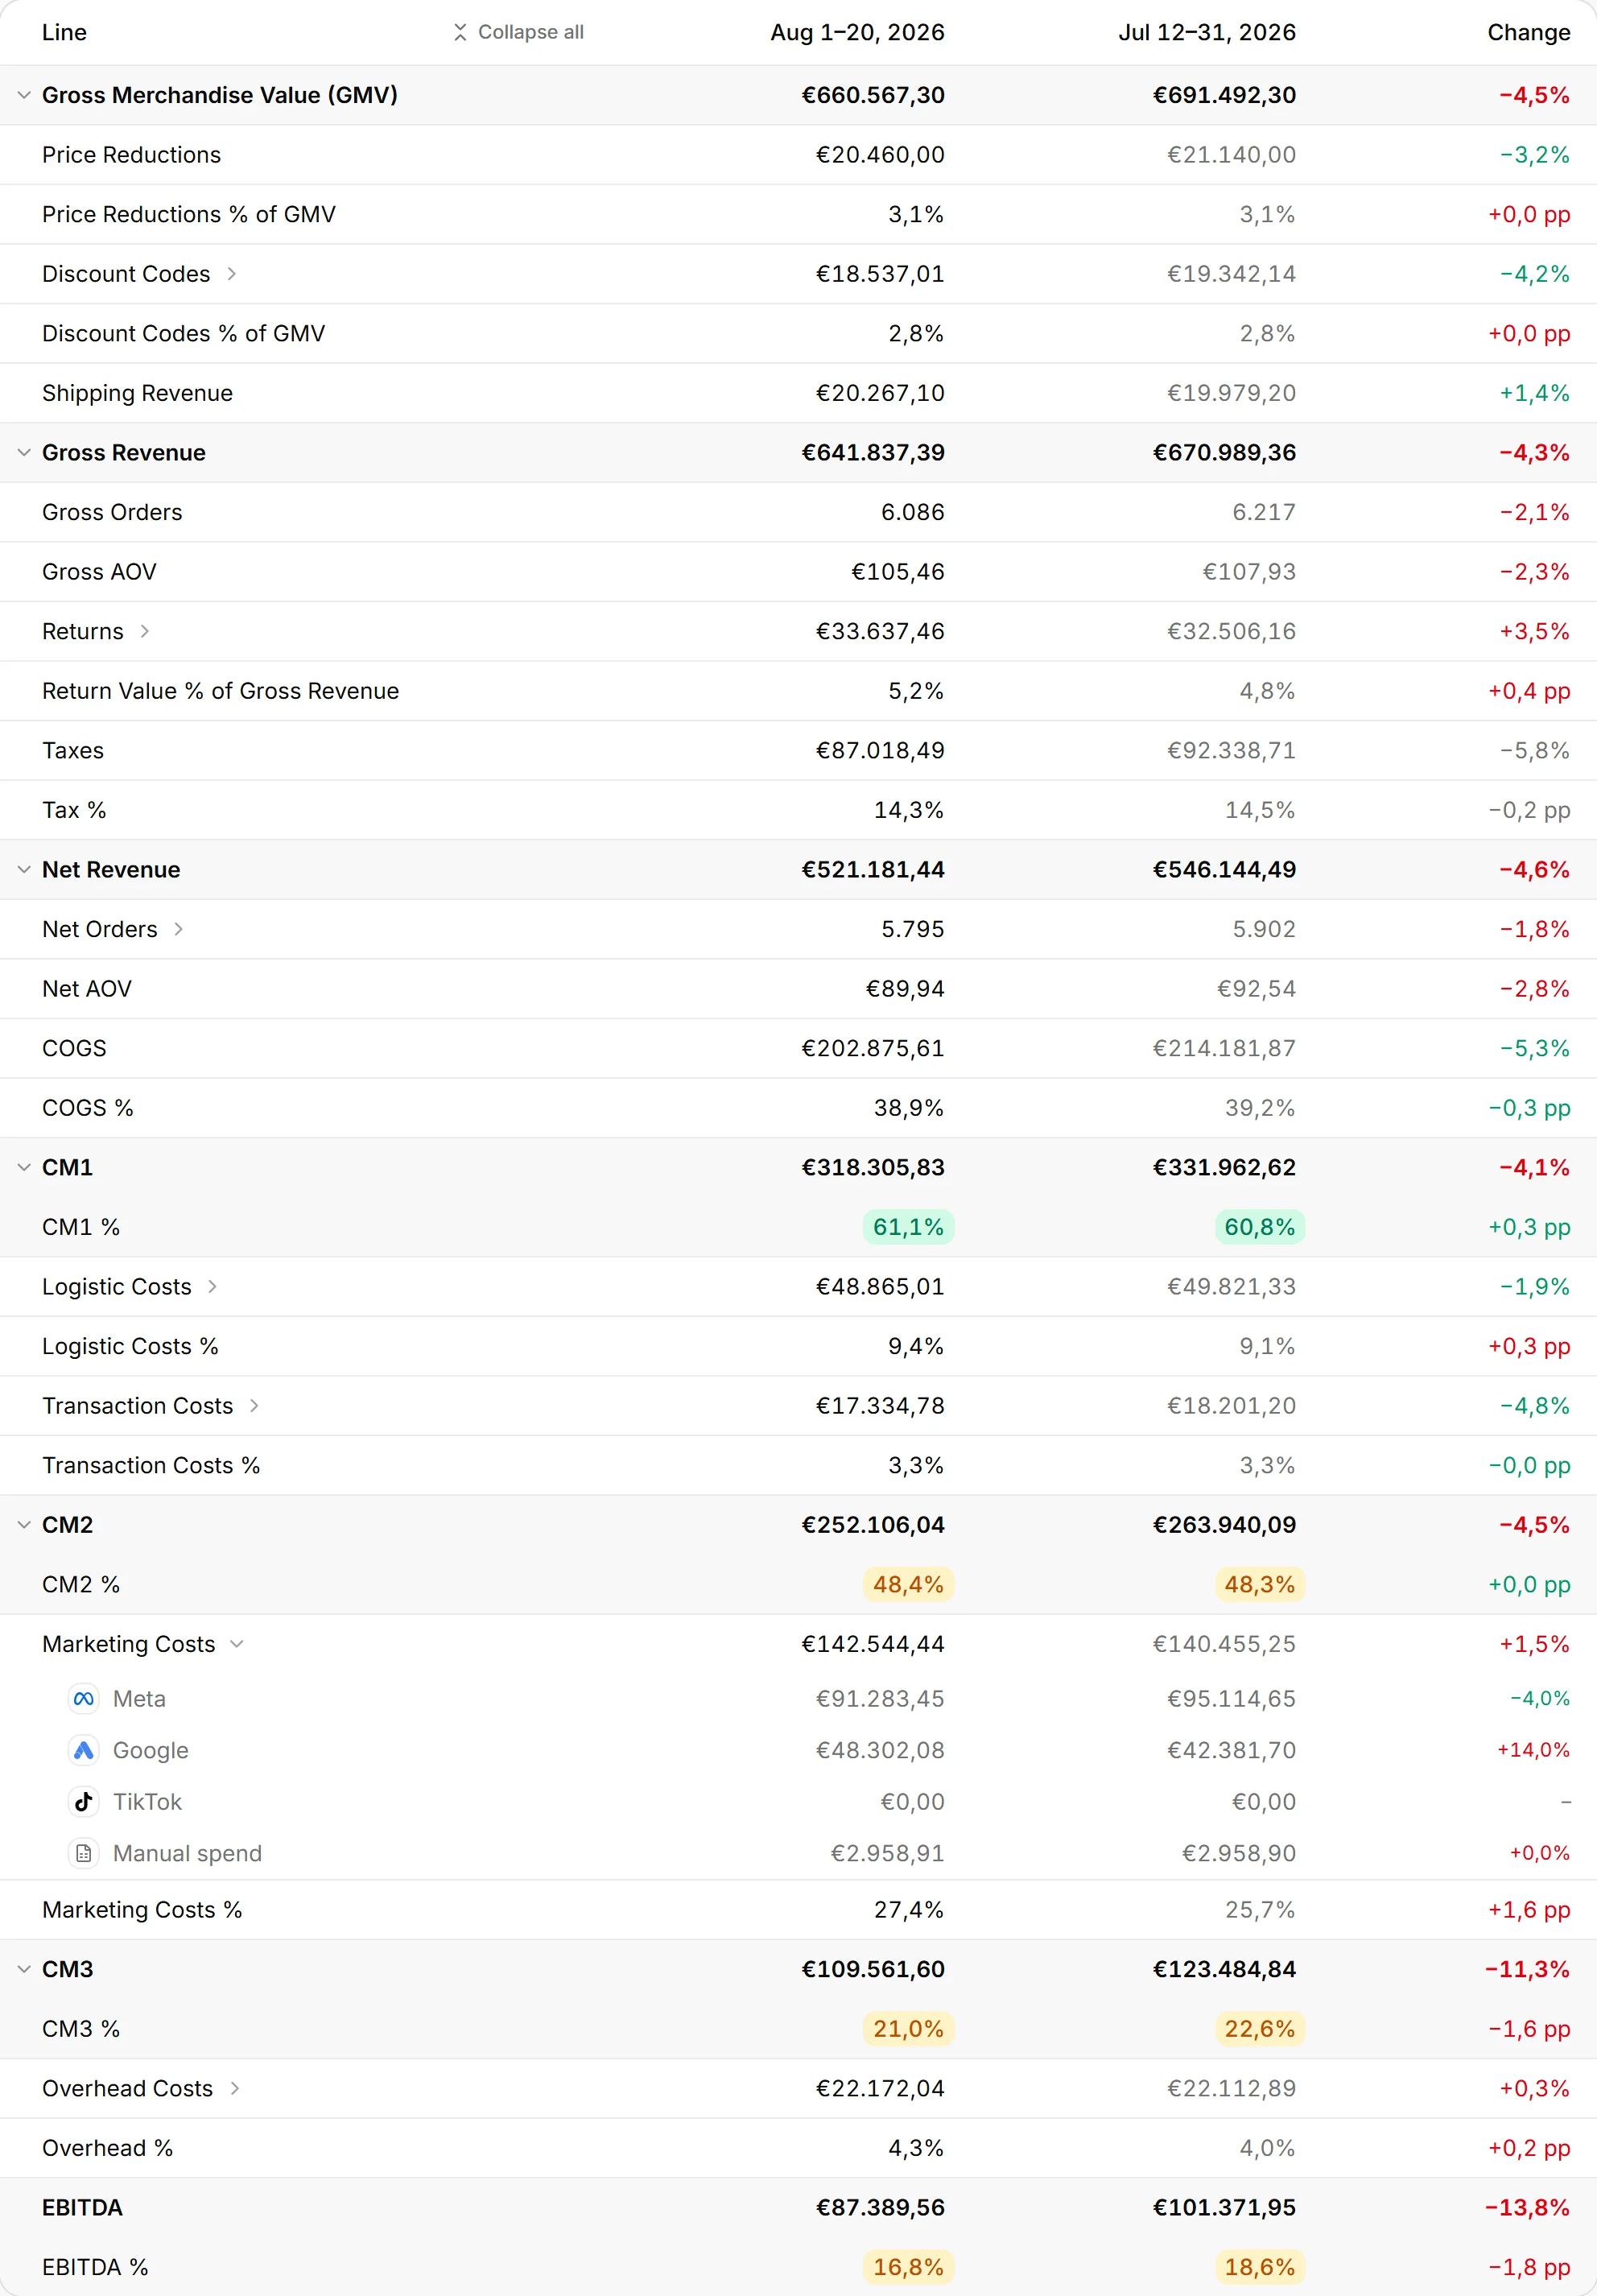
The example row is one day of the example store the site's figures come from, and its columns add up: €40.607,66 of gross revenue ends as €8.308,12 of EBITDA once returns, VAT, goods, logistics, payment fees, marketing and one day's share of overhead have each taken their piece. Discounts are shown beside them for visibility, but they are already deducted inside gross revenue, so nothing is subtracted twice.
Two habits make the file trustworthy. Book each number to the day it belongs to, so a refund lands on the day it was issued instead of changing a finished day; which day a refund belongs to decides whether last month ever stops moving. And spread overhead as the month's fixed costs divided by its days, so rent stops arriving as one bad Tuesday. When the file stops being worth the time, moving off the spreadsheet keeps what it taught you.
In nouz
nouz fills in every column of this file each night, from your orders, your ad accounts and the costs you enter once. Point at a column to find its line on the statement.
More templates
How much you have to sell before the month pays for itself.
nouz works out your real profit every night, after product costs, shipping, payment fees, ad spend and running costs, and sends it to your inbox each morning.