The spare stock that covers a late supplier or a busier week than usual, worked out both ways the textbooks teach and turned into days of cover, a reorder point and the cash it ties up.
Free, nothing to sign up forLines 17 and 18 of a nouz P&L
Safety stock at a 95,0% service level
115units
Service level method
115
9,1 days
Max-demand method
750
59,2 days
Reorder point
685
lead time demand plus this
Demand and supply
Sales
days
units
units
Supplier
days
days
days
Your choice
Method
Z × √(lead time × σ of daily sales² + daily sales² × σ of lead time²): covers the swings you can measure.
%
€
↑↓ to nudge, Shift for ten. Commas or dots both work.
This product
Sold per day12,67
Lead time demand570
Safety stock115
Reorder point685
17At landed cost−€2.202,25
Service levelsafety stockcover
90,0%89 units7,0 days
95,0%115 units9,1 days
97,5%136 units10,7 days
99,0%162 units12,8 days
99,9%215 units17,0 days
83% of the uncertainty the service level covers is the supplier’s lead time, the rest is the day-to-day swing in sales. Each step up in service level costs more stock than the one before it.
That is 9,1 days of average sales, and €2.202,25 of stock at landed cost. As a safety stock on the Forecast page in nouz, enter 10 days.
An estimate from flat rates. In nouz every order is priced from the costs of its own day.
What this calculator does
What it does
A safety stock calculator sizes the spare units that cover a late supplier or a busier week than usual. This one works it out both ways the textbooks teach, by service level from how much demand and lead time swing, and by the simpler max-demand method, then turns the answer into days of cover, a reorder point and the cash it ties up.
Two methods
One cushion, two ways of sizing it.
Safety stock is the stock held beyond what the lead time is expected to sell, so that a supplier running late or a week selling faster than usual does not empty the shelf. The question is how much, and the two common answers disagree.
The max-demand method plans for the worst of both at once: your busiest day, repeated for the whole of your slowest lead time, minus what an ordinary lead time sells. It needs no statistics, which is its strength, and it buys certainty with a lot of cash, because the worst day and the worst delivery rarely arrive together.
The service-level method covers the swings you can measure: the standard deviation of daily sales and of the lead time, scaled by a Z score for the share of order cycles you want to end without running out. Raise the service level and the cushion grows faster than the level does.
Either answer is easiest to live with in days. The Forecast page in nouz holds safety stock in days of sales and plans every product’s purchases from it, so the calculator converts its answer into the number to enter there.
The calculator’s starting product sells 12,67 units a day from a 45-day supplier, with a day-to-day spread of 4,2 units and a lead time that swings by 5 days.
A service level is the share of order cycles that end without running out. The Z score is how many standard deviations of swing that takes, read off the normal distribution, and every step up costs more stock than the one before it.
Going from 95% to 99% takes 41% more safety stock, and 99,9% needs 1,9 times the 95% cushion. The last few points of service are the most expensive stock a store holds.
Hold a high level for the products that carry the month and a lower one for the long tail, where a stockout costs a sale rather than a customer.
In the app
nouz works this out from every order, every day.
A calculator works from flat rates you type once. nouz prices every single order from the cost rules that were in force on that order's own date, and rebuilds the same statement every night from your own orders and your own ad spend.
Every cost at the rate of its own day. Product costs, parcels and payment fees per order, so a price change never rewrites last month.
Ad spend comes in by itself. Meta, Google and TikTok through their official APIs, plus anything you add by hand or by CSV.
The same lines, per product. What is left after product costs, after shipping and payment fees, and after ads, for every product you sell.
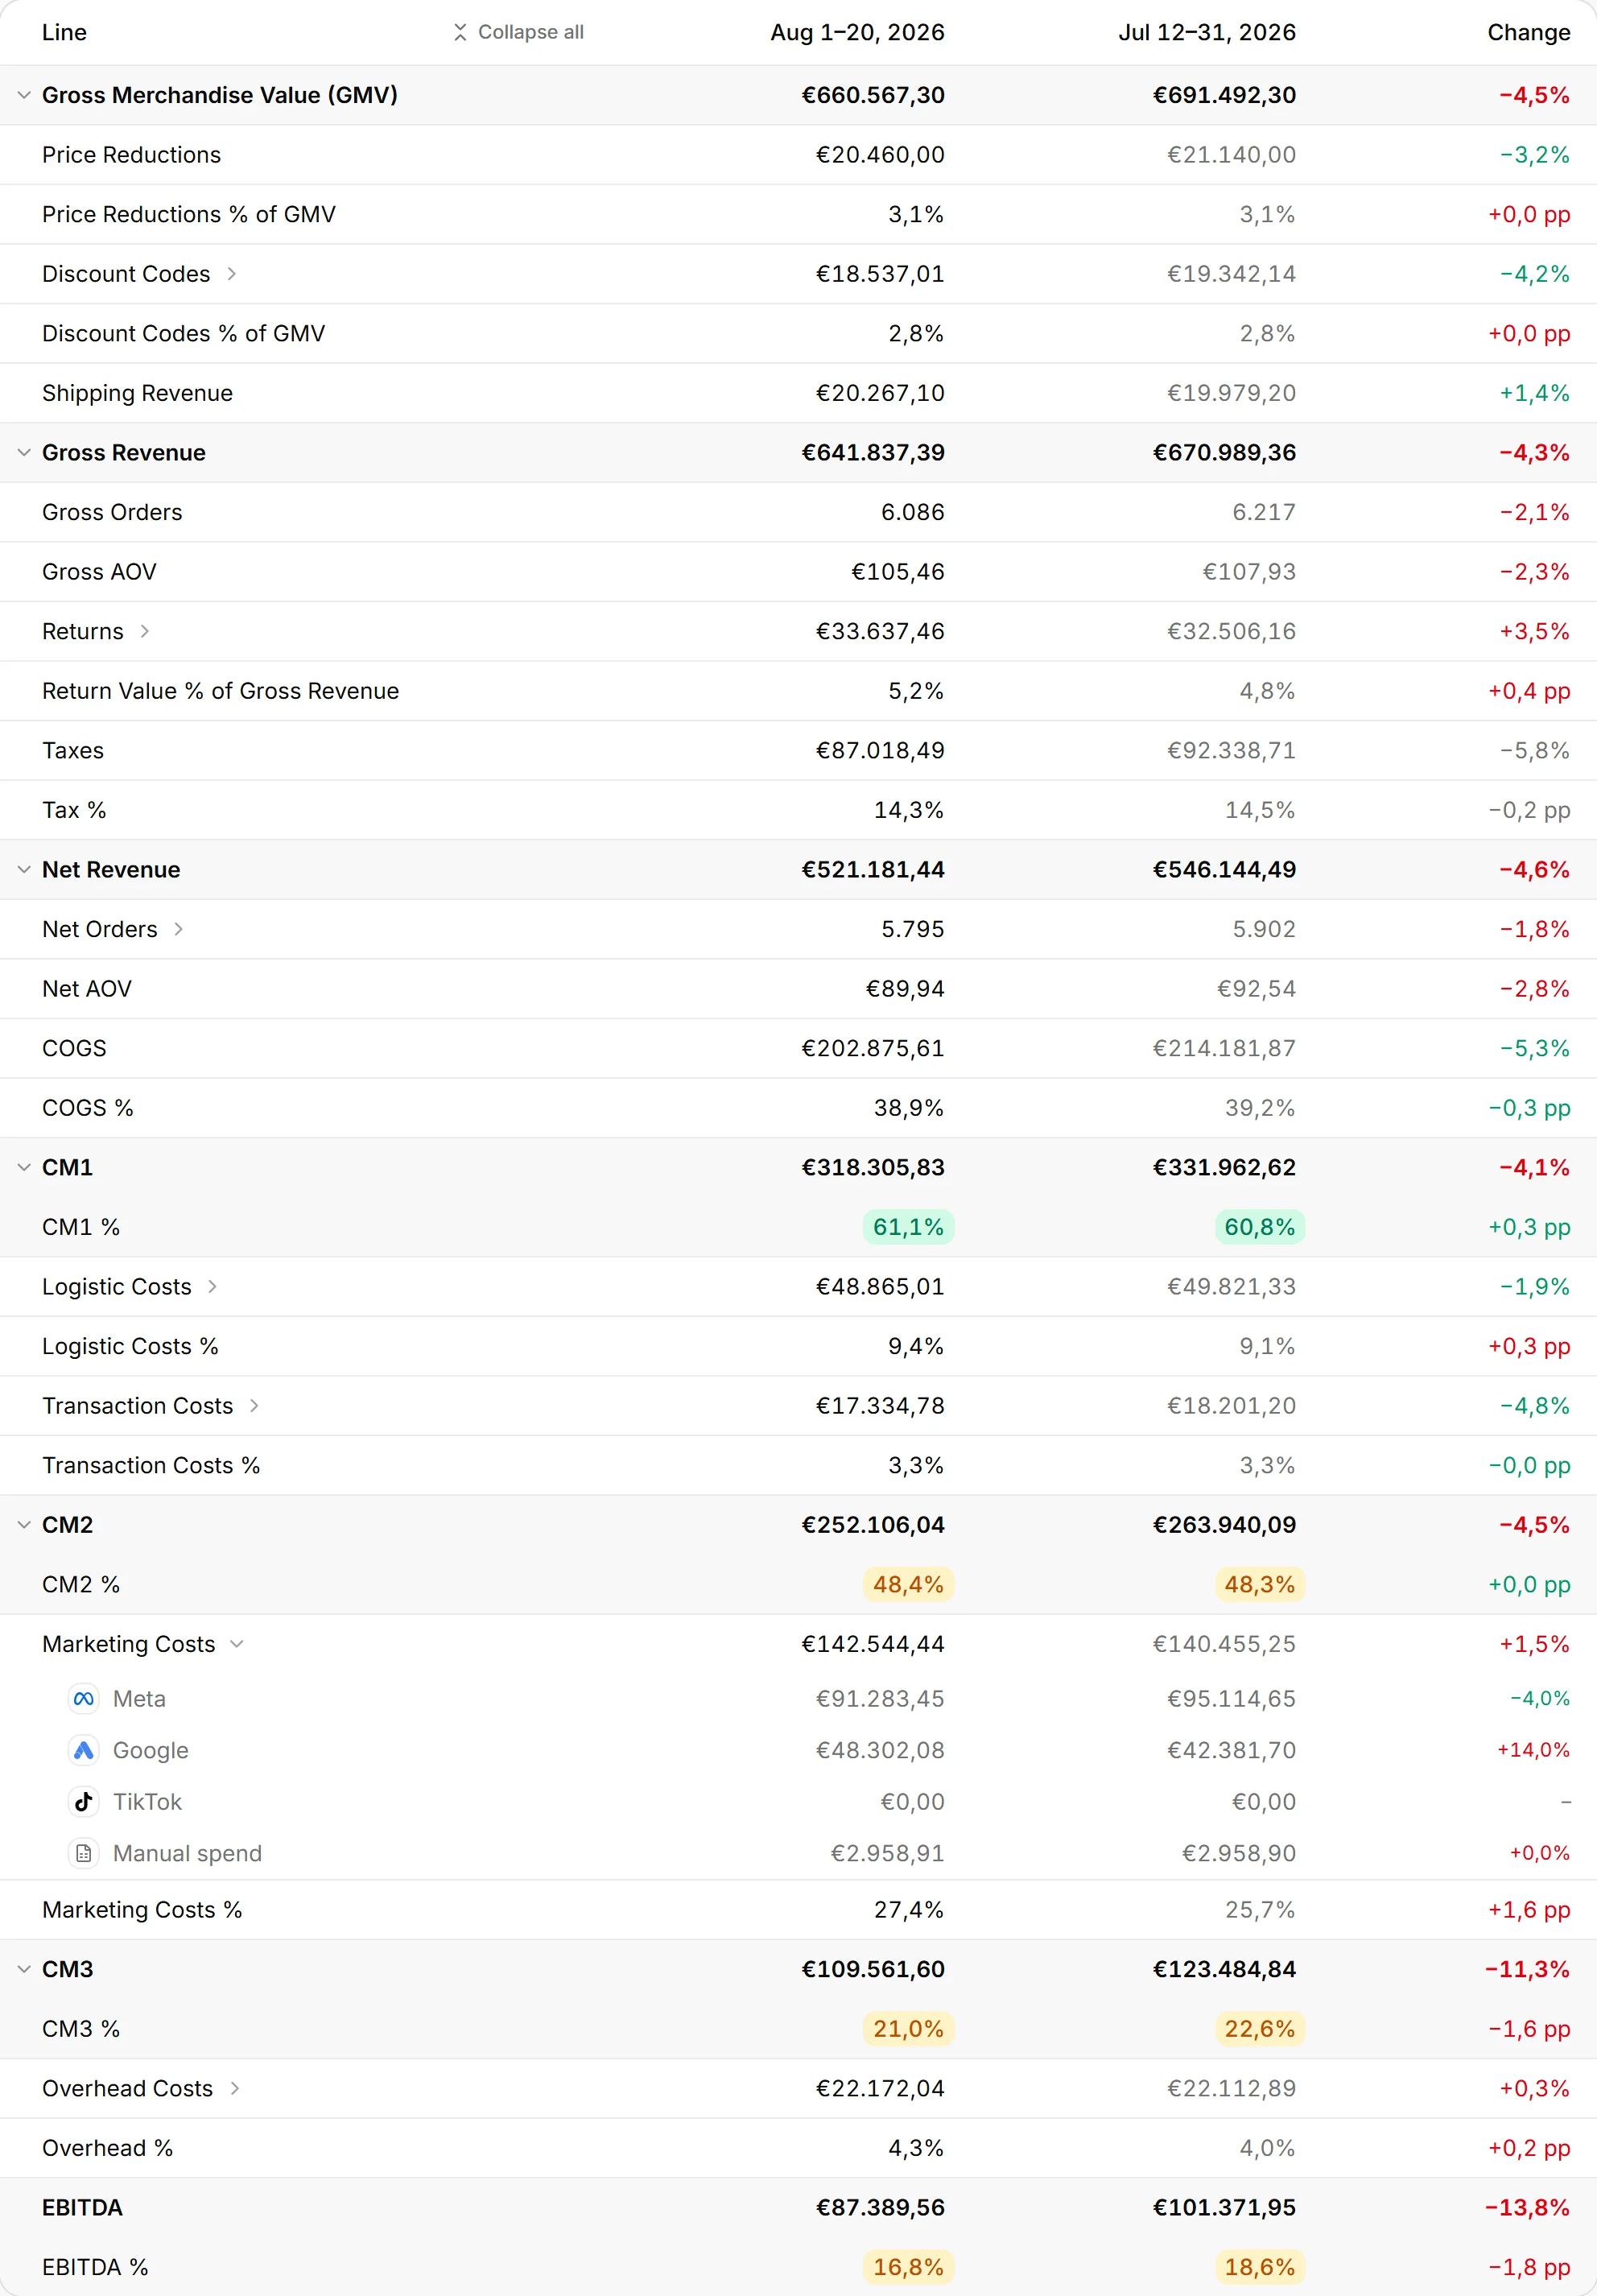
Lines 16 to 24 of the P&L in the app: this period against the one before, each margin marked against its target.
Where it goes wrong
Four ways safety stock is the wrong size.
Two of these run out and two tie up cash for nothing, and every one of them is ordinary.
The lead time the supplier promised
A quoted lead time usually ends at the factory gate or the port. Your stock has to last until the goods are saleable, after freight, customs, inspection and putaway, so measure what the last few orders really took from purchase order to shelf.
A punctual supplier assumed
On the figures above, ignoring the lead time’s swing takes the cushion from 115 to 47 units. The supplier is 83% of the risk here, more than the customers.
The max-demand method on everything
On the same product it asks for 750 units, worth €14.363 at landed cost, against 115 at a 95% service level. Across a catalogue that is warehouse space and cash spent on a coincidence.
One service level for the whole catalogue
A blanket 99% overstocks the slow half of the range to protect the fast half. Set the level by what a stockout costs: high for the products customers come for, lower for the ones they add on.
Two ways are common. The max-demand method takes your busiest day times your longest lead time and subtracts an average day times the average lead time. The service-level method multiplies a Z score by how much demand and lead time swing: Z × σ × √(lead time) when the supplier is always on time. The calculator does both and shows how far apart they land.
What service level should I choose?
The share of order cycles you want to end without running out. Each step up costs more than the last: on the figures above, going from 95% to 99% needs 41% more safety stock, and 99,9% needs 1,9 times the 95% figure. Most stores hold a high level for the products that carry the month and a lower one for the long tail.
What is the Z score in the formula?
How many standard deviations of uncertainty the stock covers, read off the normal distribution for the service level you want: 1,28 for 90%, 1,64 for 95%, 2,33 for 99%. It assumes daily demand is roughly bell-shaped, which holds for steady sellers and fails for products that sell in bursts.
Why does lead time variability matter so much?
Because a late delivery exposes you to every extra day of demand at once. On the figures above, a 45-day lead time that swings by a standard deviation of 5 days is 83% of the risk the safety stock covers, more than the day-to-day swings in sales. Steadying a lead time often cuts safety stock more than any forecast can.
Should safety stock be set in units or in days?
Days travel better. A cushion of ten days means the same thing for a product selling five a day and one selling five hundred, and it follows sales up and down without being recalculated. The Forecast page in nouz holds safety stock in days for that reason, and the calculator converts its answer so you can enter it there.
Is the max-demand method wrong?
No, it is cautious. It assumes the busiest day repeats for the whole of the slowest lead time, which almost never happens, so it holds more than the service-level method at any ordinary level. It needs no statistics, which makes it a fair first answer for a new product with too little history to measure a standard deviation.
More calculators
Four that go with this one.
Each one is a different question about the same statement. All 32 are free, and none of them asks you to sign up.
The Forecast page in nouz holds safety stock in days and plans a purchase for every product from forecast demand: when to order, how much, and what it costs at the unit cost of its own day.