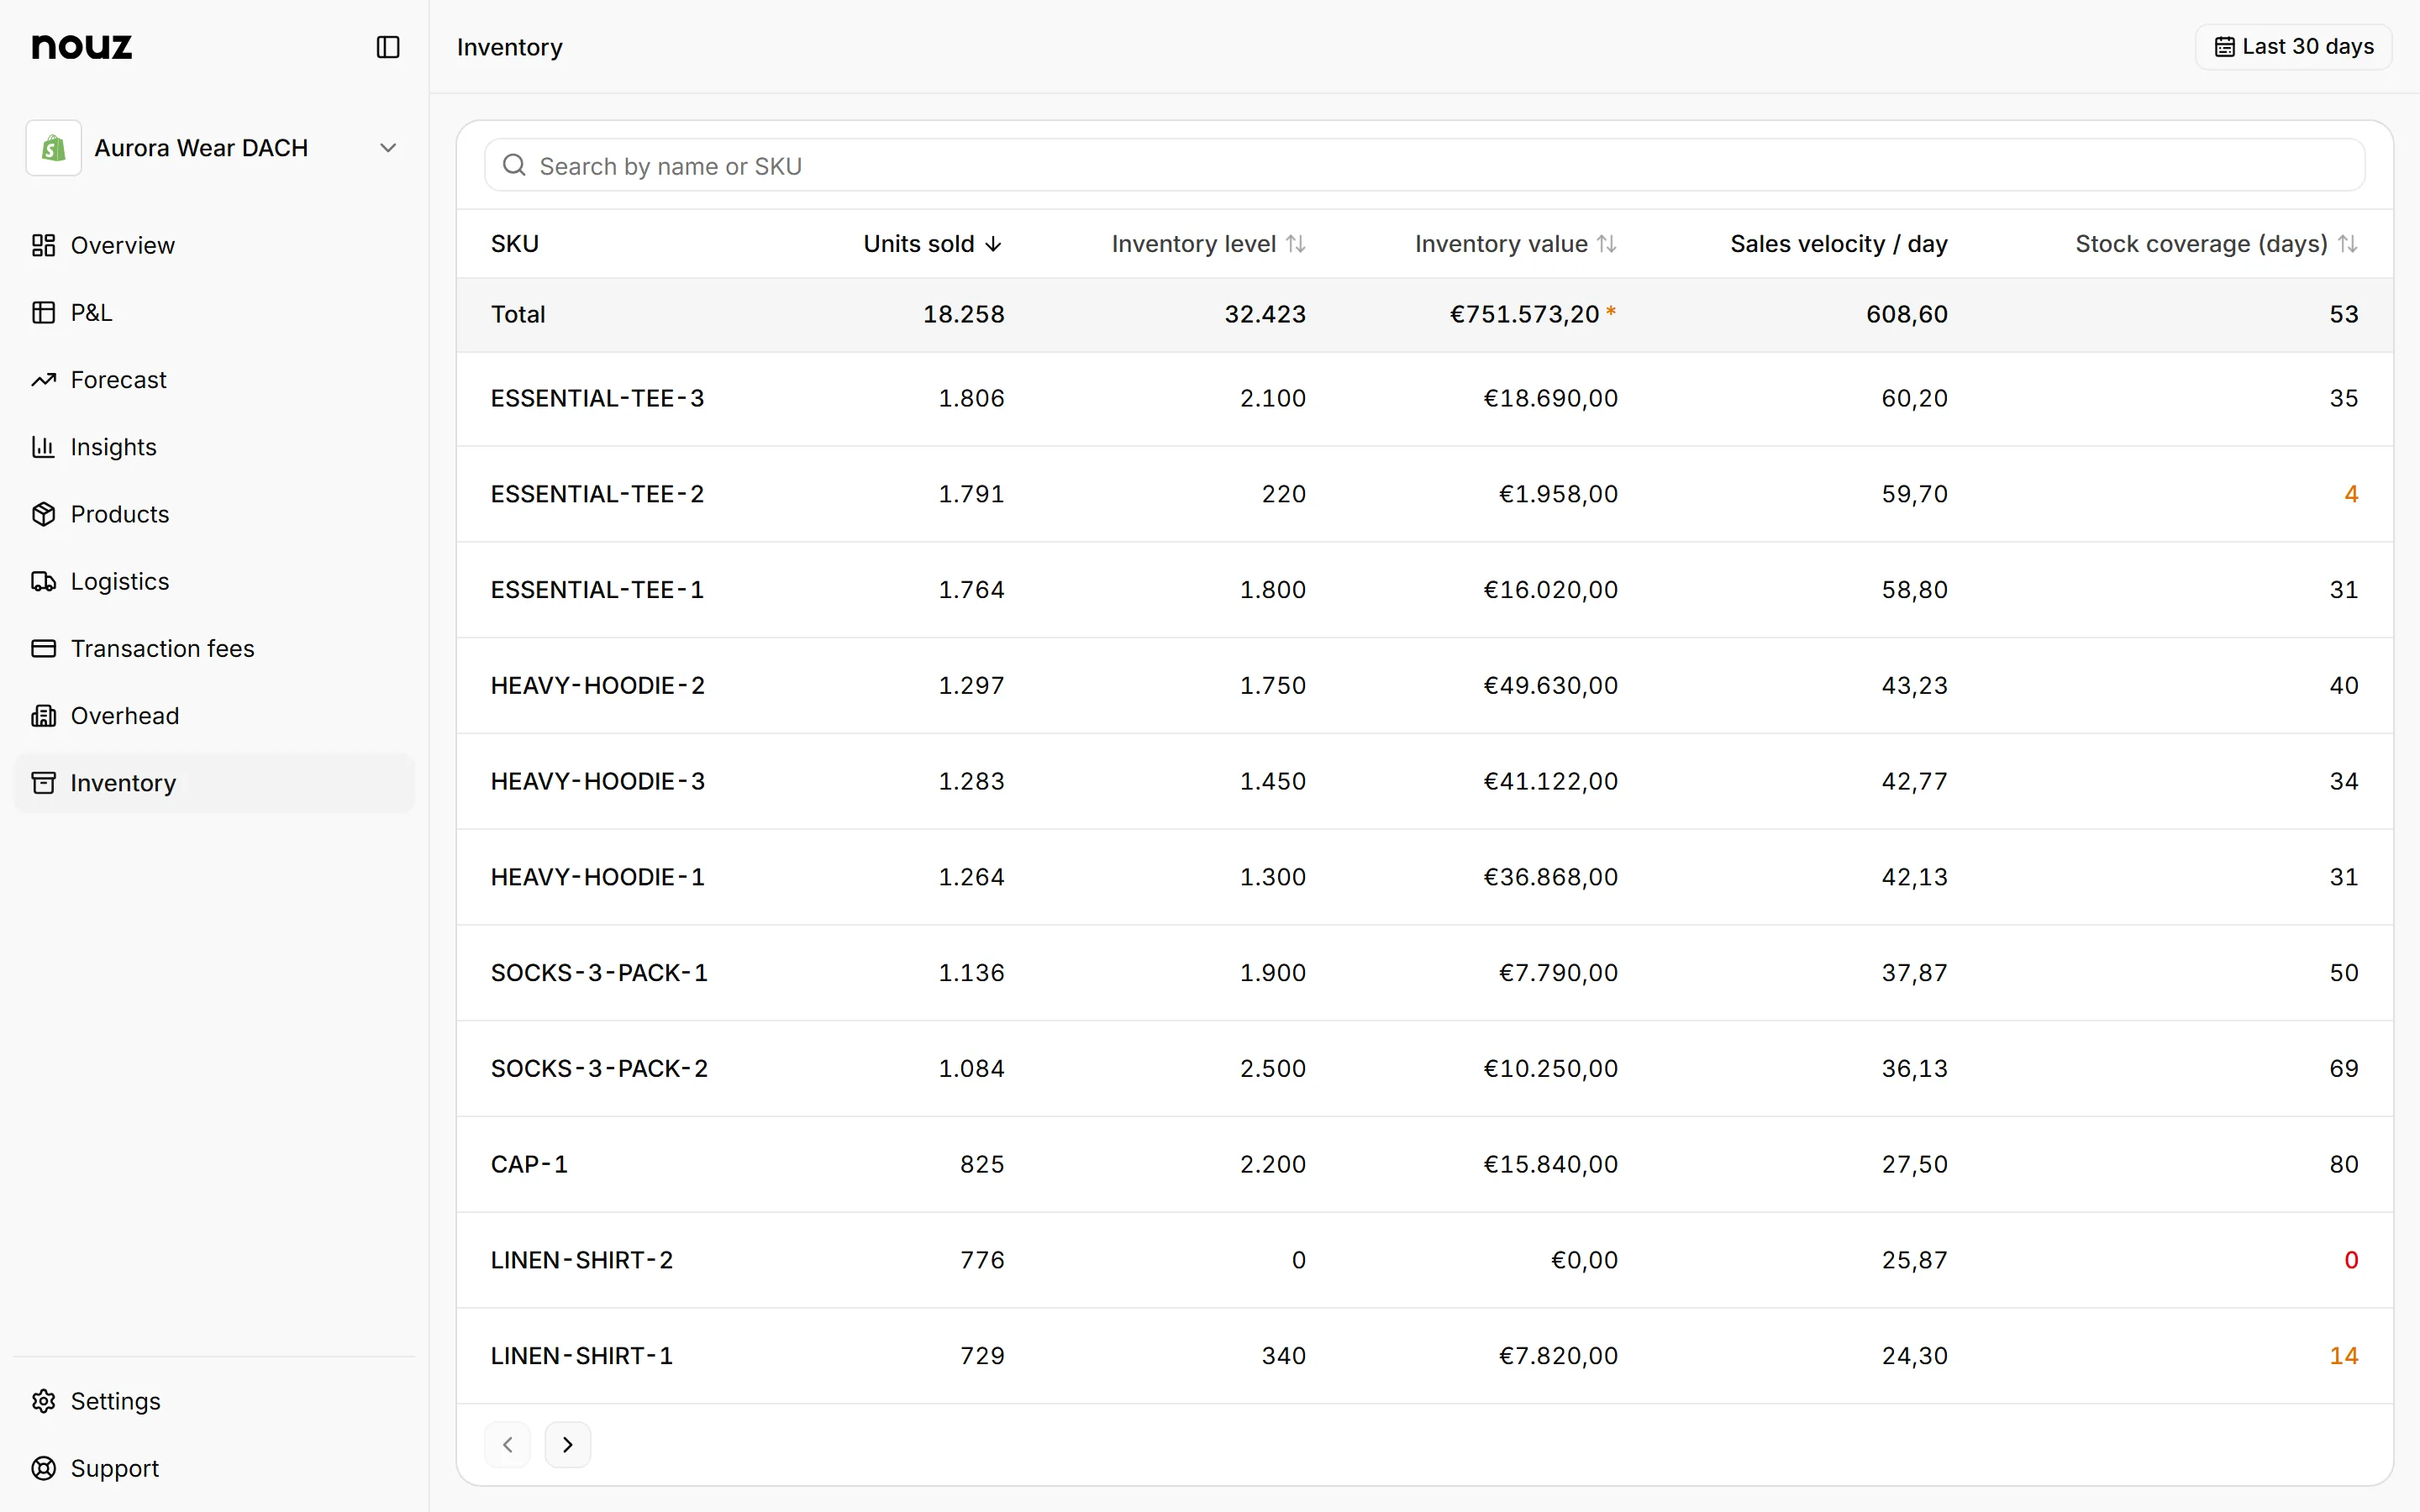
Stock coverage, also called stock cover or days of stock, is units on hand divided by units sold per day: how many days the stock you hold will last at the current pace. It turns a stock level into time, the unit that matters for reordering, and it is read against the supplier's lead time.
Worked through on the store the stock coverage calculator opens with: 420 units on hand and 380 sold over the last 30 days is a pace of 12,67 a day, so coverage is 420 ÷ 12,67, or 33 days, a little under five weeks. Against a 45-day lead time the reorder is already 12 days late, and no amount of staring at the stock level itself would have said so. Weeks of cover are the same figure divided by seven.
The comparison that makes it actionable is against lead time, plus whatever safety cover the supplier's reliability calls for. The division is deliberately naive, and that is its virtue: no forecast and no model, just the shelf against the clock, which makes it the one inventory number everyone reads the same way. When the weeks ahead will not look like the weeks behind, a sales forecast is the better denominator.
The velocity in the denominator is a choice, and it decides what the number means. A seven-day window reacts fast and panics at every spike; a thirty-day window is calm and misses a trend for weeks. Whichever window is chosen, it has to be the same one across the catalogue, or coverage stops being comparable between products.
Seasonality distorts it in both directions: coverage computed on August velocity overstates how long stock lasts into a September push, and December velocity makes January stock look like years. Around promotions, read it on the pace you expect rather than the pace you just had, which is the pace inventory forecasting supplies.
At zero velocity it is undefined rather than infinite, and should be shown as unknown. A product that has not sold in thirty days does not have infinite coverage, it has a different problem, and printing a dash instead of a number is the honest way to say so.
Read it beside inventory value at cost: high coverage on a cheap accessory is untidy, high coverage on an expensive line is where working capital goes to sleep. The pair is exactly what the Inventory page puts on one row per SKU, with the coverage marked once it falls under two weeks.