What it costs to win a customer, how much of that the first order pays back, and how long the rest takes at the repeat rate you actually observe.
Free, nothing to sign up forLines 25, 27 and 29 of a nouz P&L
Paid back on the first order
150,4%of CAC covered
27Blended CAC
€29,70
spend ÷ new customers
Orders to payback
0,66
at this contribution
29Year one, net of CAC
€55,19
at the observed repeat rate
Your acquisition
€
What a customer brings back
€
orders
An observed ratio from your own orders, never a predicted lifetime: orders divided by customers over a period you can check.
↑↓ to nudge, Shift for ten. Commas or dots both work.
One customer
27Spend to win one customer−€29,70
25Contribution, first order€44,68
Orders in year one−1,90
Contribution in year one€84,89
29Year one after acquisition€55,19
Everything here is blended and observed: no attribution model, no prediction. The repeat rate is orders divided by customers over a period you measured, which makes the payback a fact about last year rather than a forecast about next. The cohort version, lifetime value by first-order month, is the LTV tab inside nouz.
It costs €29,70 to win a customer whose first order contributes €44,68. The business funds its own growth, and every repeat order after that is margin.
An estimate from flat rates. In nouz every order is priced from the costs of its own day.
What this calculator does
What it does
A CAC payback calculator divides ad spend by new customers to get a blended acquisition cost, then asks how much of it the first order's contribution covers. Where it does not cover it, the calculator reports the orders and months needed at your observed repeat rate.
The formula
For a store that holds stock, the first order is the test.
Software can wait a year to recover an acquisition cost because serving a customer costs almost nothing. A store cannot: the next order needs stock, and the stock has to be bought before the customer returns. So the question that decides whether growth funds itself is whether the FIRST order’s contribution covers what winning the customer cost.
Contribution, not revenue. Revenue includes the goods, the parcel and the fees, none of which pay anything back. Measuring payback against revenue is how a store concludes it recovers acquisition immediately when it recovers half of it.
Everything here is blended: total spend over total new customers, with no platform attributing anything to itself. And the repeat rate is an observed ratio from your own orders, not a predicted lifetime, which keeps the answer a fact about what happened rather than a forecast about what might.
Where it goes wrong
Four ways payback looks faster than the bank agrees.
Each of these makes acquisition look cheaper or the return look quicker than it is.
Payback measured on revenue
An €85 order does not pay back €85 of acquisition cost. It pays back what survives the goods, the parcel and the fee, which on typical economics is around half of it. Revenue-based payback is the single commonest error in this arithmetic.
CAC taken from platform-reported conversions
Every platform claims the customers it can see, and the claims overlap, so per-platform CAC figures are always flattering and never add up. Total spend over total new customers is the only version that cannot double count.
Repeat rates borrowed from somebody else
Category benchmarks are not your customers. The ratio you need is your own orders divided by your own customers over a period long enough to include real repeat behaviour, and it is usually lower than the industry article suggested.
Forgetting that repeat orders need stock
A twelve-month payback is a twelve-month loan to yourself, and the reorders happen in between. That is why a store can be profitable per customer and out of cash at the same time, and why the first-order threshold matters more here than in software.
The calculator’s defaults, on the example store: €15.000 of ad spend won 505 new customers in the month, each first order contributing €44,68 after goods, fulfilment and fees, and customers placing 1,9 orders a year.
That is €29,70 to win a customer, against €44,68 of contribution on the very first order.
This store funds its own growth: the first order covers the acquisition cost half again over, so every additional customer adds cash rather than consuming it, and the €55,19 of year-one contribution net of acquisition is what pays the rent.
Push CAC to €75 by scaling into colder audiences and the picture inverts: the first order recovers 60% of it, the rest waits for repeat orders that take 10,6 months to cover it, and the store is financing its own growth from working capital.
In the app
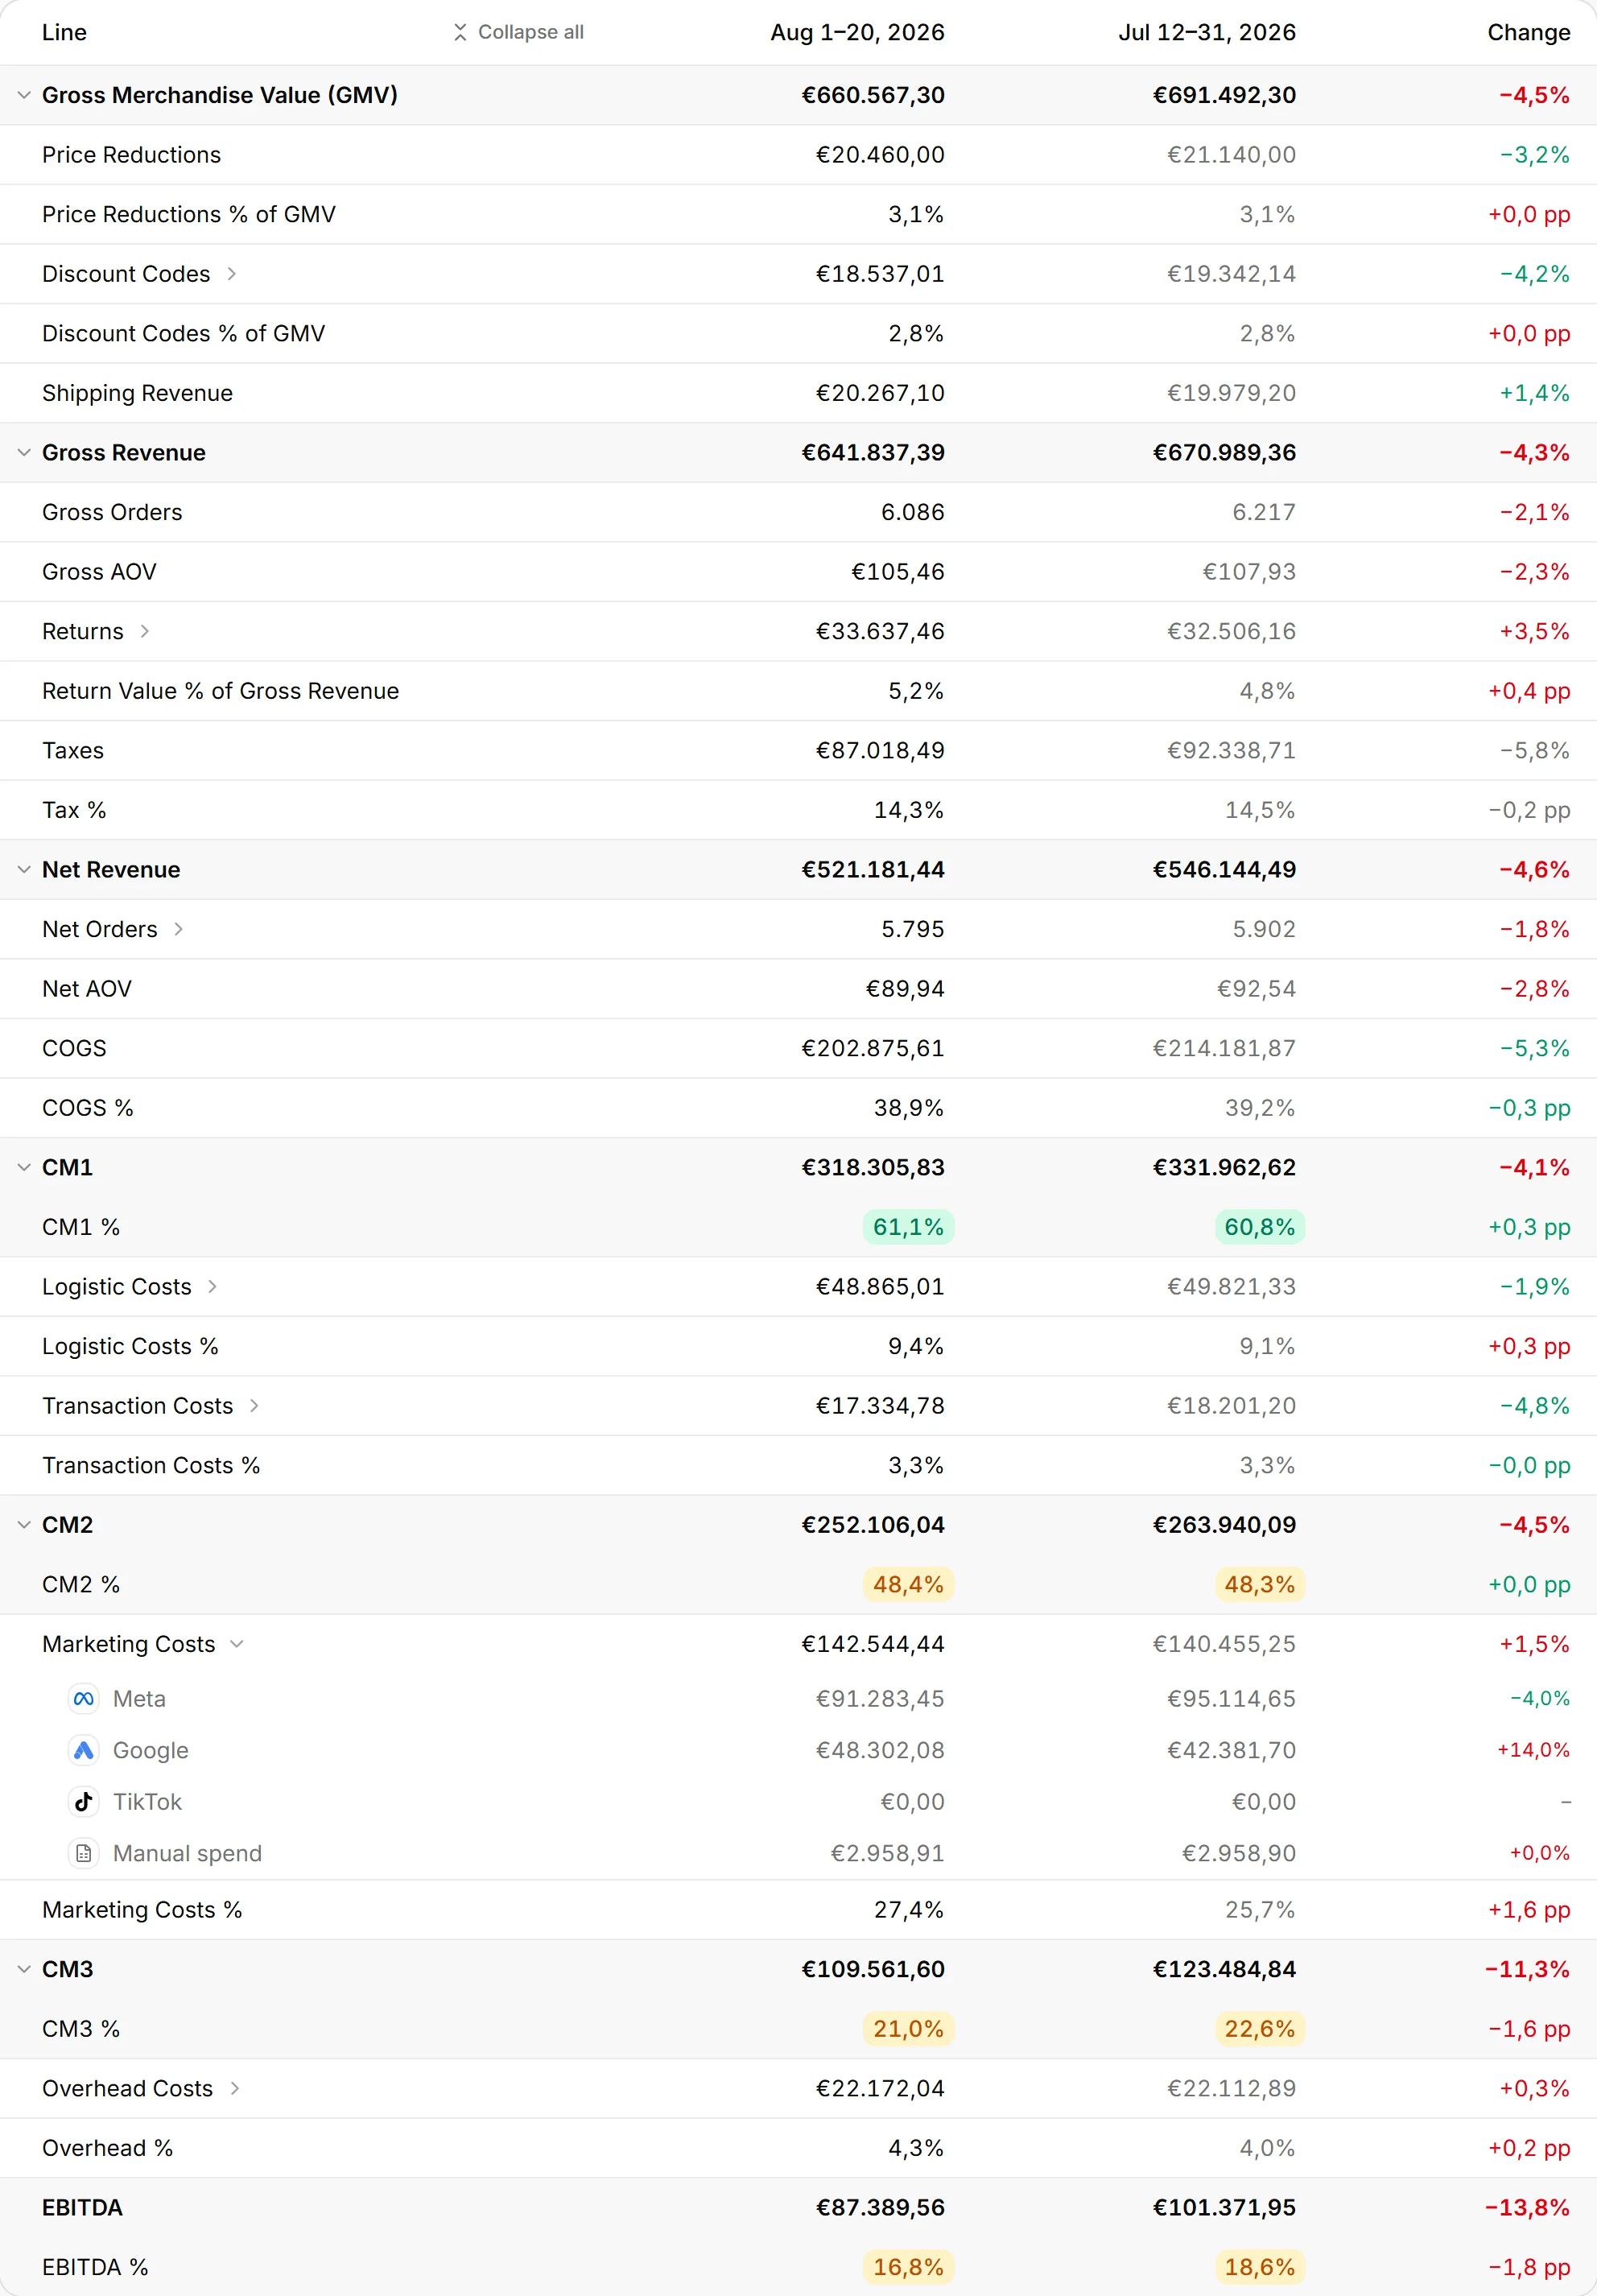
nouz works this out from every order, every day.
A calculator works from flat rates you type once. nouz prices every single order from the cost rules that were in force on that order's own date, and rebuilds the same statement every night from your own orders and your own ad spend.
Every cost at the rate of its own day. Product costs, parcels and payment fees per order, so a price change never rewrites last month.
Ad spend comes in by itself. Meta, Google and TikTok through their official APIs, plus anything you add by hand or by CSV.
The same lines, per product. What is left after product costs, after shipping and payment fees, and after ads, for every product you sell.
How long it takes for a customer to contribute back what it cost to win them. The important threshold is the first order: if its contribution already exceeds the acquisition cost, growth funds itself. If it does not, every new customer is financed out of working capital until they come back.
How do I calculate blended CAC?
Total acquisition spend divided by new customers won in the same period, both from your own systems. Blended means no attribution: every euro counts once and every customer counts once, so the figure cannot be inflated by two platforms claiming the same order.
Should payback be measured on revenue or contribution?
Contribution, always. Revenue includes the goods, the parcel and the fees, none of which pay back anything. Measuring payback against revenue is how a store concludes it recovers acquisition on the first order when it recovers barely half of it.
Is this lifetime value?
Not on this page. There is no cohort curve and no prediction here: the repeat rate is orders divided by customers over a period you measured, which makes the answer a fact about what already happened rather than a forecast. The LTV calculator values a customer over a whole period in revenue and in contribution, and the cohort version, lifetime value by first-order month, is the LTV tab inside nouz, computed from the same orders.
What is a good payback period?
For a store selling physical goods, the first order is the benchmark worth aiming at, because inventory has to be bought again before the second order arrives. Anything beyond a few months means growth consumes cash faster than it produces it, which is survivable when planned and fatal when discovered late.
More calculators
Four that go with this one.
Each one is a different question about the same statement. All 32 are free, and none of them asks you to sign up.
nouz computes blended CAC and what a first order actually contributes from your own orders and costs, so the threshold that decides whether growth funds itself is a number you can read every morning.