MER calculator: blended ROAS, CAC and break-even MER
Measured against your own revenue and your own margin, not against what the platforms claim. Including the MER you need just to cover the cost of what you sold.
Free, nothing to sign up forLines 14 to 29 of a nouz P&L
Blended MER, from your own revenue
4,00x
25POAS
2,10x
margin per ad euro
27Blended CAC
€34,25
438 new customers
CM2 per order
€44,68
what one order contributes
Your period
What happened
€
€
orders
%
What each order costs
%
€/order
%
POAS needs a margin, not just revenue, which is the whole difference between it and ROAS.
What the platforms claim
€
Optional. Add up the revenue Meta, Google and TikTok each report and paste the total.
↑↓ to nudge, Shift for ten. Commas or dots both work.
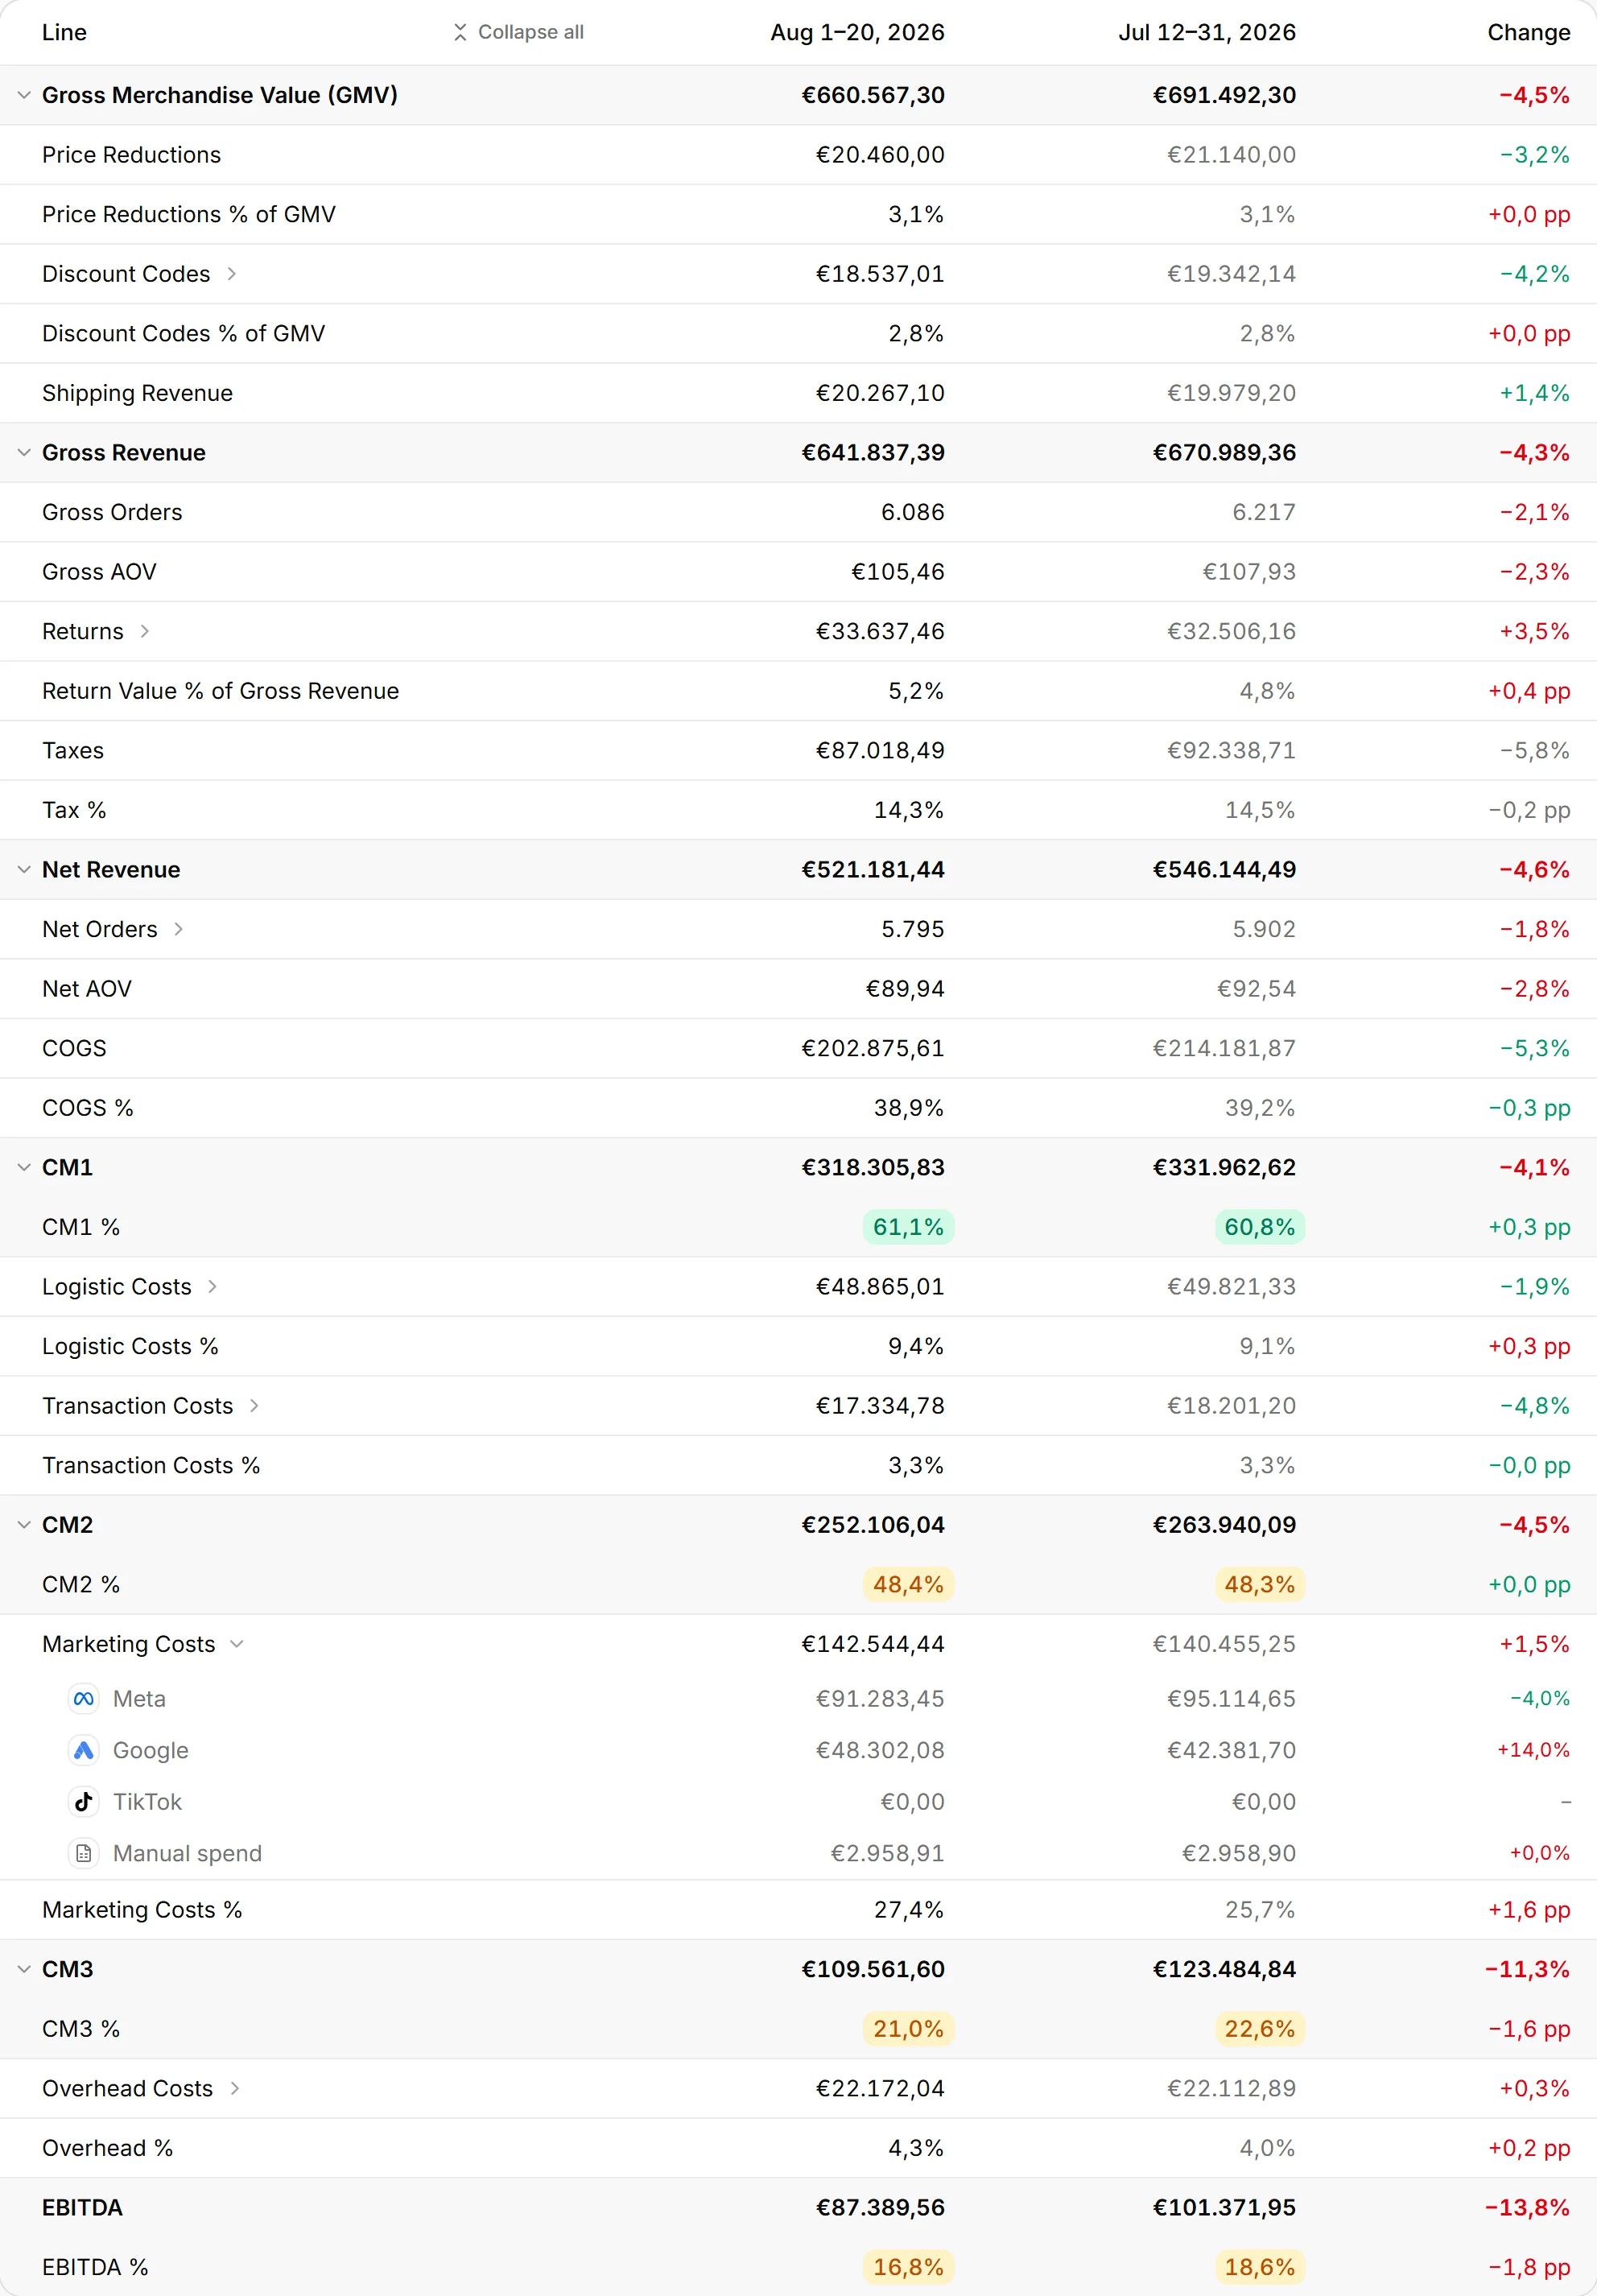
The statement
14Net revenue€60.000,00
17Cost of goods−€22.800,00
21Shipping and packing−€4.518,40
23Payment fees−€1.140,00
25CM2€31.541,6052,6%
27Ad spend−€15.000,00
29CM3€16.541,6027,6%
Break-even MER at this cost structure1,90x
What the platforms report, against what arrived
5,20xreported ROAS
4,00xactual MER
The platforms between them claim 30,0% more revenue than the store took. That is not fraud, it is what overlapping attribution windows do, and it is why one order can be counted three times.
A first order contributes €44,68 and costs €34,25 to win, so you are €10,43 up on the first purchase before the second one is even a question.
Every euro of advertising brought in €4,00 of net revenue, and kept €2,10 of contribution margin. You need 1,90x just to cover the cost of what you sold, so there is €16.541,60 of room before advertising stops paying for itself.
An estimate from flat rates. In nouz every order is priced from the costs of its own day.
What this calculator does
What it does
This calculator works out MER, POAS and blended CAC from your own revenue, contribution margin, ad spend and new customer count. Blended means platform claims never enter it: one numerator, one denominator, nothing counted twice, plus the MER you need before advertising even breaks even.
The formulas
Three ratios, three different questions.
MER asks whether the machine is running at a ratio you can afford. POAS asks whether the margin, not the revenue, covers the spend. CAC asks what one new customer costs, so it can be held against what one new customer is worth on their first order.
They are all blended, which is the point. One numerator, one denominator, both from your own books. The platform figures cannot do this, because each platform counts every conversion it can plausibly claim and the claims overlap. A store spending on Meta and Google routinely sees the two report, between them, a third more revenue than the store took. That is not fraud, it is what overlapping attribution windows do, and it makes the sum of platform ROAS figures unusable as a business number.
The one figure most stores never compute is the break-even MER. Advertising is paid for out of CM2, so every euro of spend has to bring back enough revenue to cover the goods, the parcel and the payment fee before it has done anything at all. That threshold is net revenue divided by CM2, and it moves only when your cost structure moves.
None of these is anyone acting in bad faith. They are all what happens when a number is read outside the statement it belongs to.
Platform ROAS figures added together
Meta reports the orders it can see, Google reports the orders it can see, and a customer who clicked both is claimed by both. Adding the two revenue figures produces a number larger than your actual sales, and the ratio built from it is correspondingly optimistic.
The test takes ten seconds: add up what every platform claims and compare it with your own net revenue. If the first is bigger, you already know not to budget on it.
Revenue used where margin belongs
A 4x return on ad spend sounds comfortable until you notice the advertising is not paid out of revenue. It is paid out of CM2, which for a typical DACH apparel store is a bit over half of net revenue, so a 4x MER is really about a 2x return on the money that was actually available.
That is what POAS measures, and it is the ratio that changes when the product mix changes even though the marketing did not.
Only the platforms' own spend counted
Influencer fees, affiliate commissions, agency-bought placements and the channels with no API at all are real marketing costs, and they are usually missing from the denominator because they are not in an ad account.
Every euro spent to win orders belongs in the spend figure, on the day it was spent. A MER computed on only the connected platforms is a number about your integrations, not about your marketing.
CAC compared with revenue instead of contribution
A €34 acquisition cost against an €85 average order looks like a wide margin. Against the €44,68 that order actually contributes after goods, shipping and fees, it is a €10 profit on the first purchase.
That is still a good business, but it is a completely different risk profile, and it is the version that tells you how much a small rise in CAC would cost.
Worked example
A 4x MER, looked at properly
The calculator’s own defaults, not a customer’s books. €60.000 of net revenue in a month, €15.000 of advertising across every channel, 706 orders, 62% of them from a first-time customer. Goods at 38%, a parcel at €6,40, gateways at 1,9%. The ad platforms between them report €78.000 of attributed revenue.
MER is 4,00 and the reported ROAS is 5,20, which is the platforms claiming 30% more revenue than the store took. POAS is 2,10: every euro of advertising returned €2,10 of contribution margin, which is the number that can actually be spent.
The break-even MER is 1,90, so the store is running at more than twice the ratio it needs and has about €16.500 of room before advertising stops paying for itself. That is the useful sentence, and it is invisible on any dashboard that reports revenue over spend without knowing the margin.
On acquisition: 438 new customers at €34,25 each, against a first order contributing €44,68. The store is €10,43 up on the first purchase, so the repeat rate is upside rather than a requirement. A CAC of €45 would flip that, which is worth knowing before the budget goes up rather than after.
In the app
nouz works this out from every order, every day.
A calculator works from flat rates you type once. nouz prices every single order from the cost rules that were in force on that order's own date, and rebuilds the same statement every night from your own orders and your own ad spend.
Every cost at the rate of its own day. Product costs, parcels and payment fees per order, so a price change never rewrites last month.
Ad spend comes in by itself. Meta, Google and TikTok through their official APIs, plus anything you add by hand or by CSV.
The same lines, per product. What is left after product costs, after shipping and payment fees, and after ads, for every product you sell.
Marketing efficiency ratio: total net revenue divided by total advertising spend, both taken from your own books. If you took €60.000 net and spent €15.000 across every platform, your MER is 4,00. There is one numerator and one denominator, so nothing can be counted twice, which is what makes it usable as a single source of truth.
What is the difference between MER and ROAS?
ROAS is attributed revenue divided by spend, reported by the platform that is asking to be paid. Every platform claims every conversion it can plausibly see, so the same order is often claimed by two or three of them and the ROAS figures add up to more revenue than the store actually took. MER is blended and cannot double count. Keep ROAS for comparing two creatives inside one account on one day, and use MER for the business.
What is POAS?
Profit on ad spend: contribution margin divided by ad spend, rather than revenue divided by ad spend. It answers what you kept from what the advertising sold instead of what it sold. It matters most when the catalogue is mixed, because two products with the same revenue can carry very different margins and a campaign pushing the thin one looks excellent on ROAS while losing money.
What MER do I need to break even?
Net revenue divided by CM2, which is the reciprocal of your CM2 margin. At a 52,6% CM2 margin, every euro of advertising has to bring in €1,90 of net revenue just to cover the goods, the parcel and the payment fee. Below that, the ads are being paid for out of your overhead. The calculator above works this out from the cost figures you enter.
How do I calculate blended CAC?
Total advertising spend divided by the number of new customers won in the same period. Blended, so every euro counts and every new customer counts, rather than only the ones a platform claims. Judge it against what a first order actually contributes, which is CM2 per order, not against revenue.
Does nouz do attribution?
No, deliberately. Attribution modelling and tracking pixels are out of scope. Blended numbers answer the question a store between €0 and €10M actually acts on, which is whether the advertising is paying for itself overall. If you need to know which ad did it, that is a different and much more expensive tool, and you should buy one.
More calculators
Four that go with this one.
Each one is a different question about the same statement. All 32 are free, and none of them asks you to sign up.