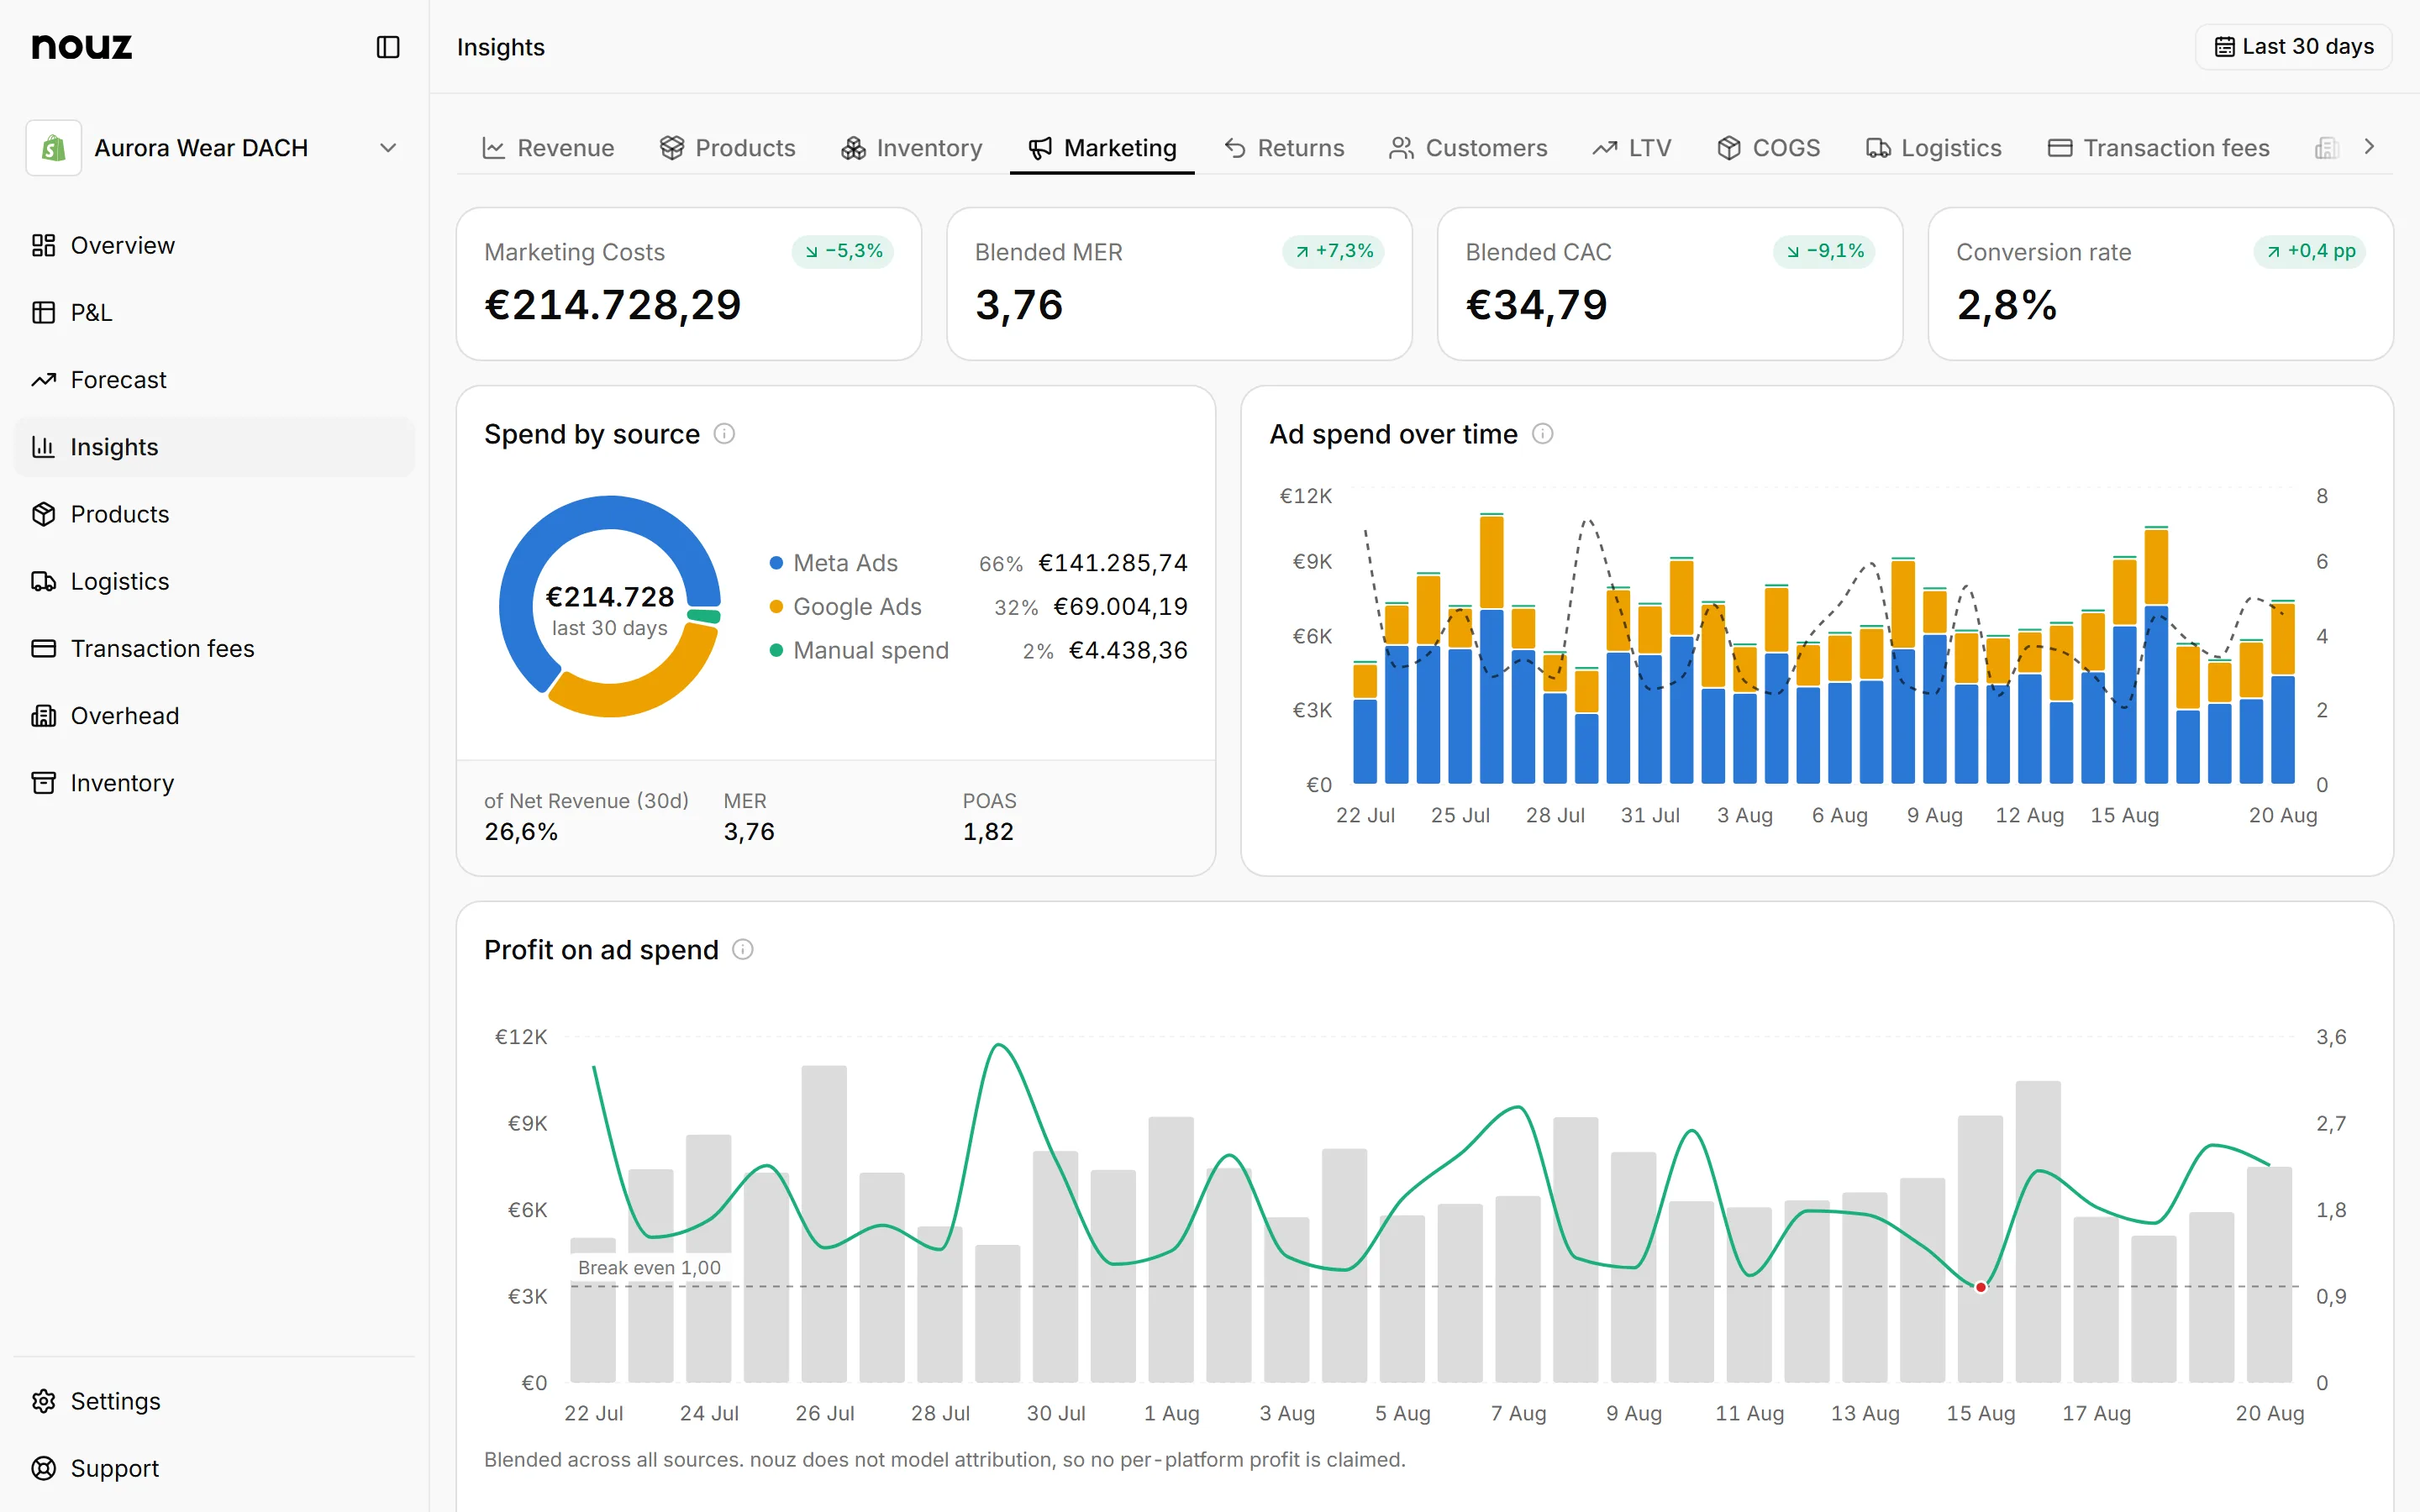
MER, the marketing efficiency ratio, is total net revenue divided by total advertising spend across every platform, both taken from your own books. One numerator and one denominator mean nothing can be double counted, which is what platform-reported ROAS cannot promise.
It cannot double count, because there is only one numerator. That makes it the honest counterweight to platform ROAS figures, which overlap and therefore add up to more revenue than you actually took. The full comparison of the three ratios is in MER, POAS or ROAS.
Worked through on the example store the calculators use: €60.000 of net revenue in a month on €15.000 of advertising is a MER of 4,00, four euros of net revenue for every euro spent. Its CM2 margin, what is left after goods, parcels and payment fees, is 52,6%, so its break-even MER, net revenue divided by CM2, is 1,90: below that ratio the advertising costs more than the orders it brings leave behind. At 4,00 the store has room, and the gap between the two numbers is the headroom a bigger budget would spend.
It will not tell you which campaign worked, and it is not meant to. It tells you whether the whole machine is running at a ratio you can afford, and what ratio you can afford is set by your CM2 margin, not by a benchmark. Setting an ad budget from your margin turns that ratio into an amount to spend.
Use net revenue rather than gross on top. Gross revenue still carries the VAT you never keep, which flatters the ratio by the whole VAT rate and makes two months with different return rates uncomparable.
Read it over weeks rather than days. Ad spend lands on the day the platform charged it, while the orders it bought can arrive days later, so a single day's MER swings with timing; a month says what the budget is actually doing. In nouz the Marketing tab on Insights shows MER beside POAS, blended CAC and the break-even MER for the range you pick, and the MER calculator runs the same arithmetic on your own figures.