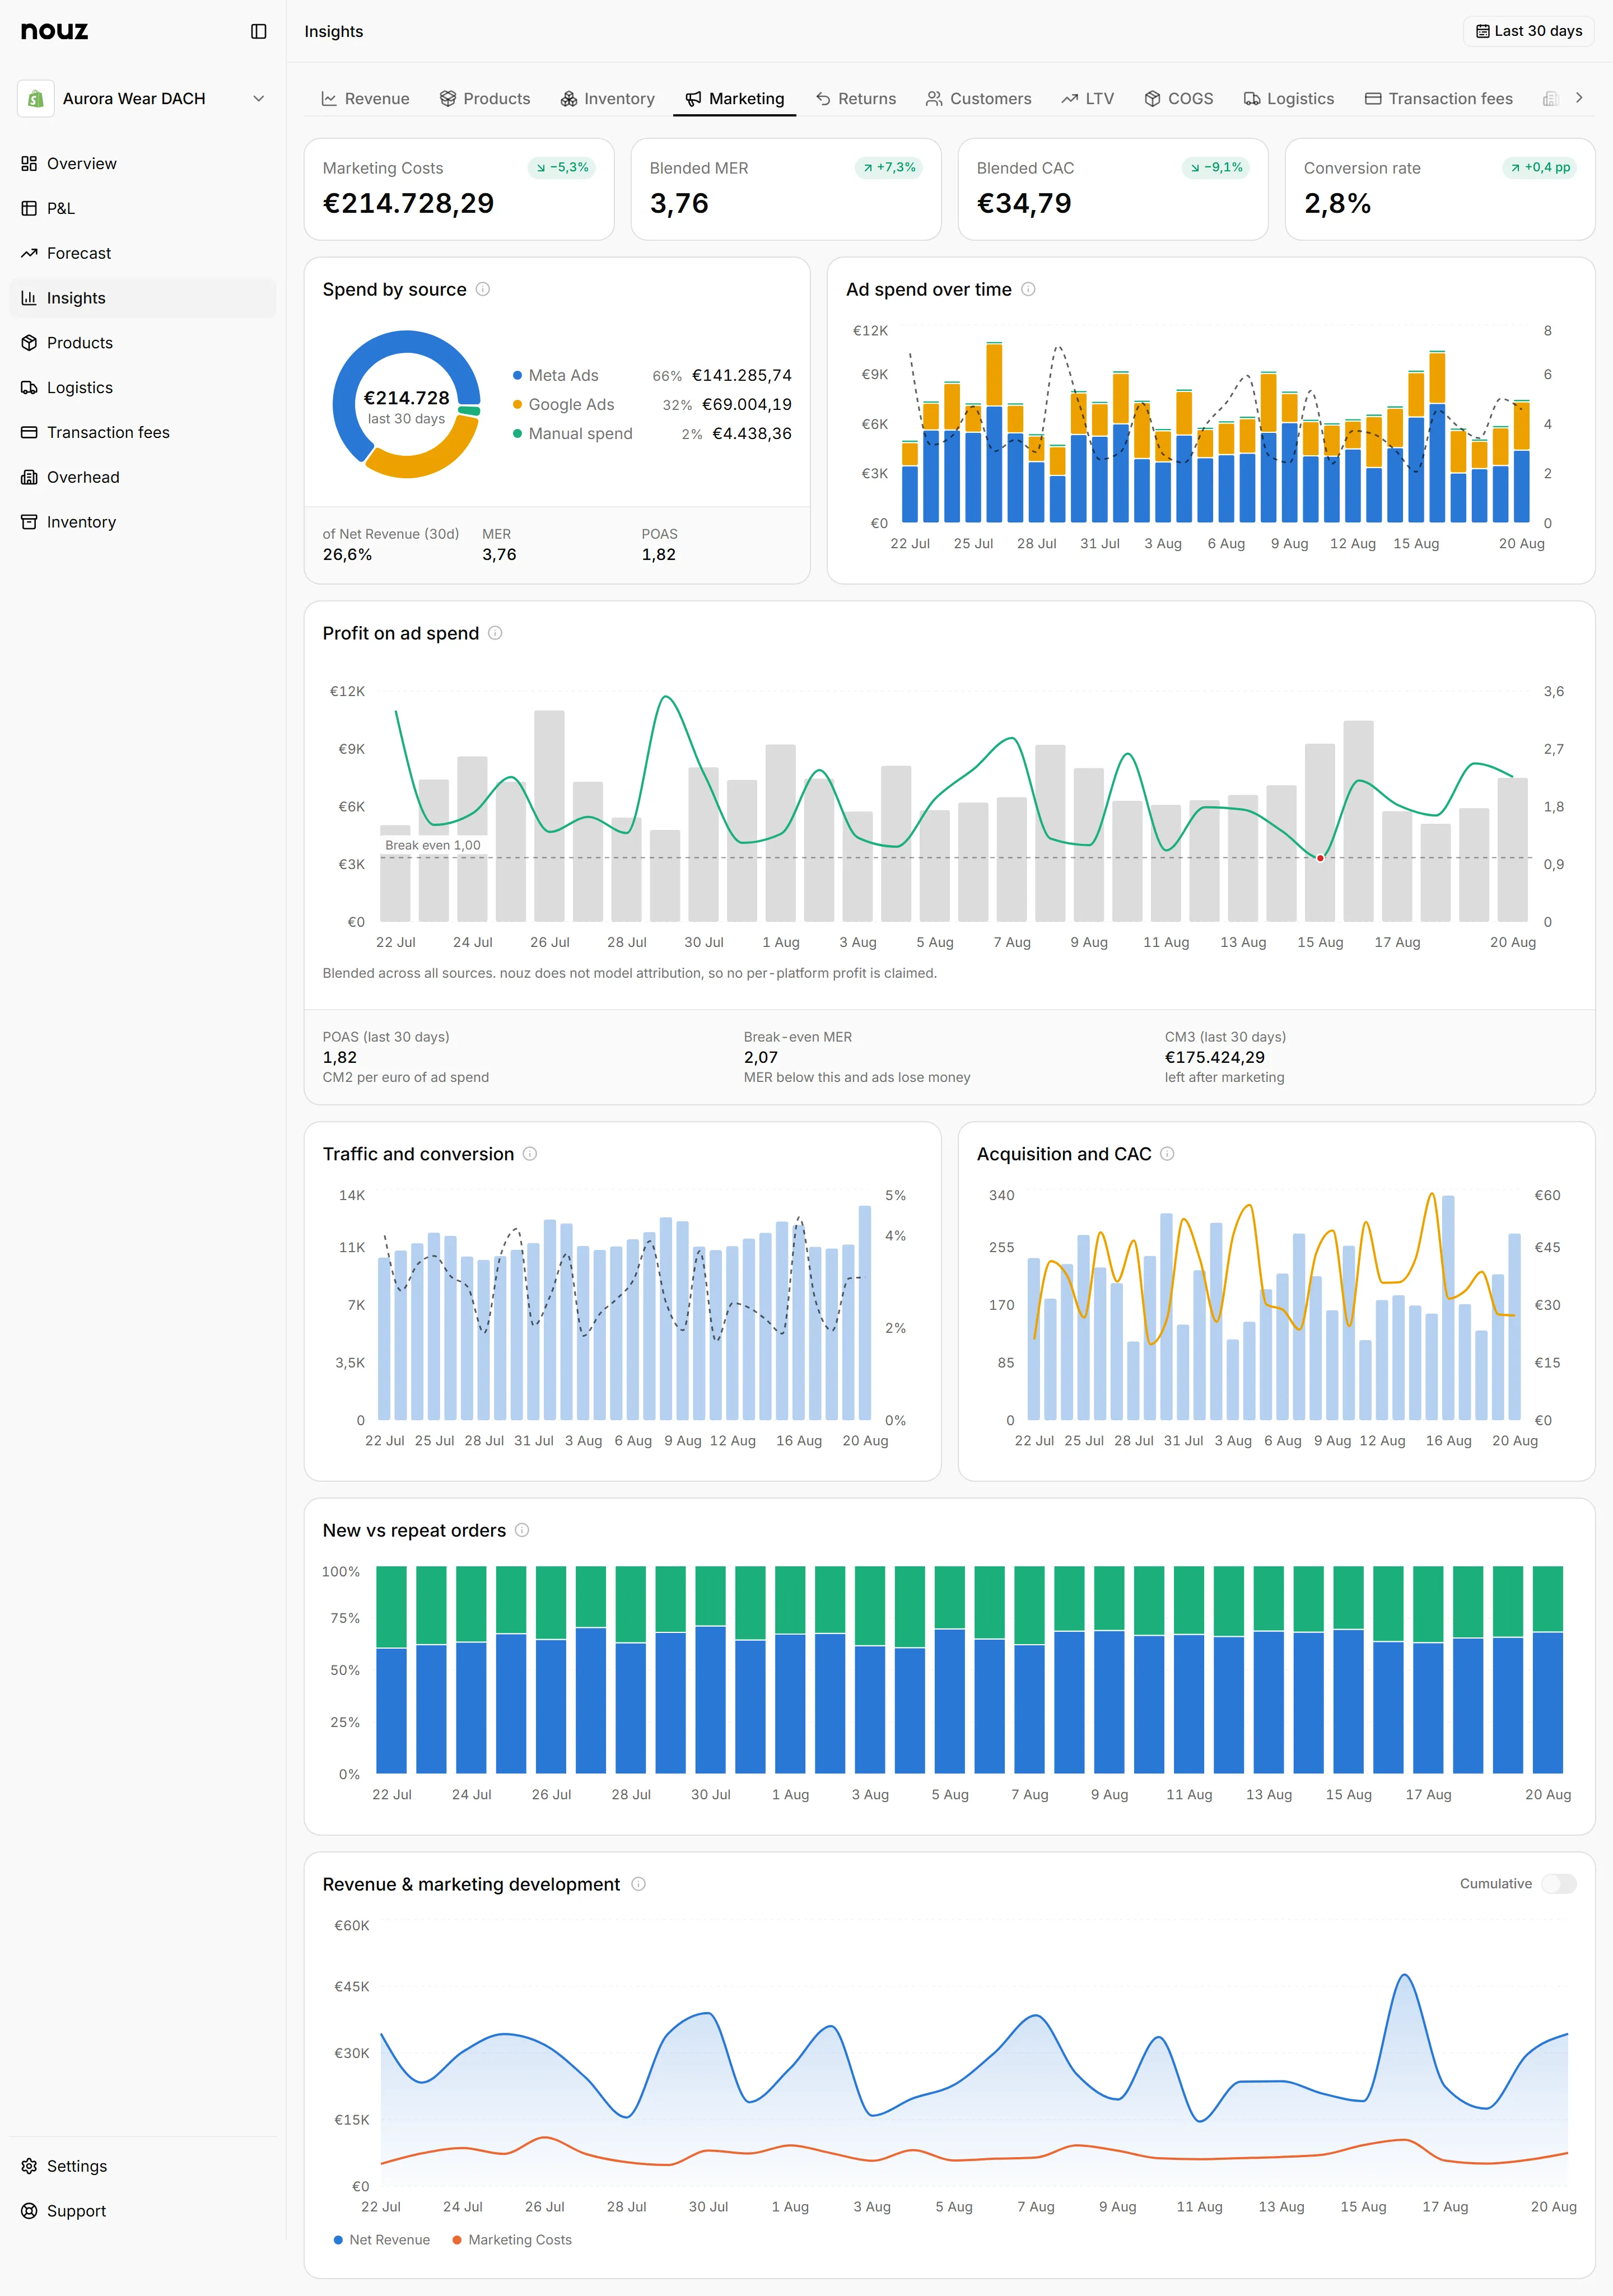
POAS, profit on ad spend, is contribution margin divided by advertising spend. Where ROAS asks how much revenue the ads sold, POAS asks how much you actually kept from what they sold, which makes it the ratio that survives a mixed catalogue with very different margins.
It matters most when the catalogue is mixed. Two products with identical revenue can carry very different margins, and a campaign pushing the thin one looks excellent on ROAS while losing money.
Worked through on the example store the calculators use: €15.000 of advertising in a month against €31.541,60 of CM2, what the orders left after goods, parcels and payment fees, is a POAS of 2,10. Every euro of advertising came back as €2,10 of contribution, so after paying for itself it left €1,10 towards everything else.
A POAS above 1 means the advertising paid for itself out of contribution margin. What it needs to be depends on the overhead it also has to cover, which is a number your own statement has and no benchmark does. The same store carries €7.000 of fixed costs a month, so at €15.000 of spend its POAS has to clear (15.000 + 7.000) ÷ 15.000, about 1,47, before the month makes a profit; at 2,10 it does, with €9.541,60 of EBITDA.
Compute it blended, on your own margin data, rather than from a platform's claimed conversions; the POAS calculator does exactly that from your spend, your purchase value and your cost shares, and sets the ROAS a platform reports beside it.
Which margin goes on top is a choice worth stating. nouz uses CM2, the margin before any advertising, so POAS says what the ads earned back before a euro of them is paid for; a version built on gross margin ignores the parcels and the fees and reads higher than the truth. Insights, Marketing draws it month by month against the line at 1,00, beside MER and blended CAC.