Break-even ROAS is the lowest return on ad spend an ad platform can report before the ads start losing money: the purchase value the platform counts, divided by CM2, what an order leaves before marketing. Because Shopify sends Meta the order total with VAT and shipping in it, that floor sits above the blended break-even MER.
It is a floor rather than a target. Above it the advertising is building profit, whatever the bank balance feels like this week; below it, every euro spent buys a loss, whatever a platform's own dashboard reports.
Worked through on the example store the calculators use: an €85 order, VAT out, leaves €44,68 of CM2. The blended version, net revenue over CM2, is the break-even MER, 1,90. The same order reaches Meta as €101,15, VAT included, so the ROAS Meta has to report before those ads pay for themselves is 2,26. An ad account set up to report values without VAT is held to the figure excluding VAT instead, here the same 1,90. The break-even ROAS calculator works out both figures from your own order.
Because it is derived from margin, it moves whenever margin does. A supplier increase, a heavier product mix or a returns spike all raise the revenue each ad euro must produce, which is the deepest reason ad decisions belong on a statement that is recomputed rather than on a threshold set once a year.
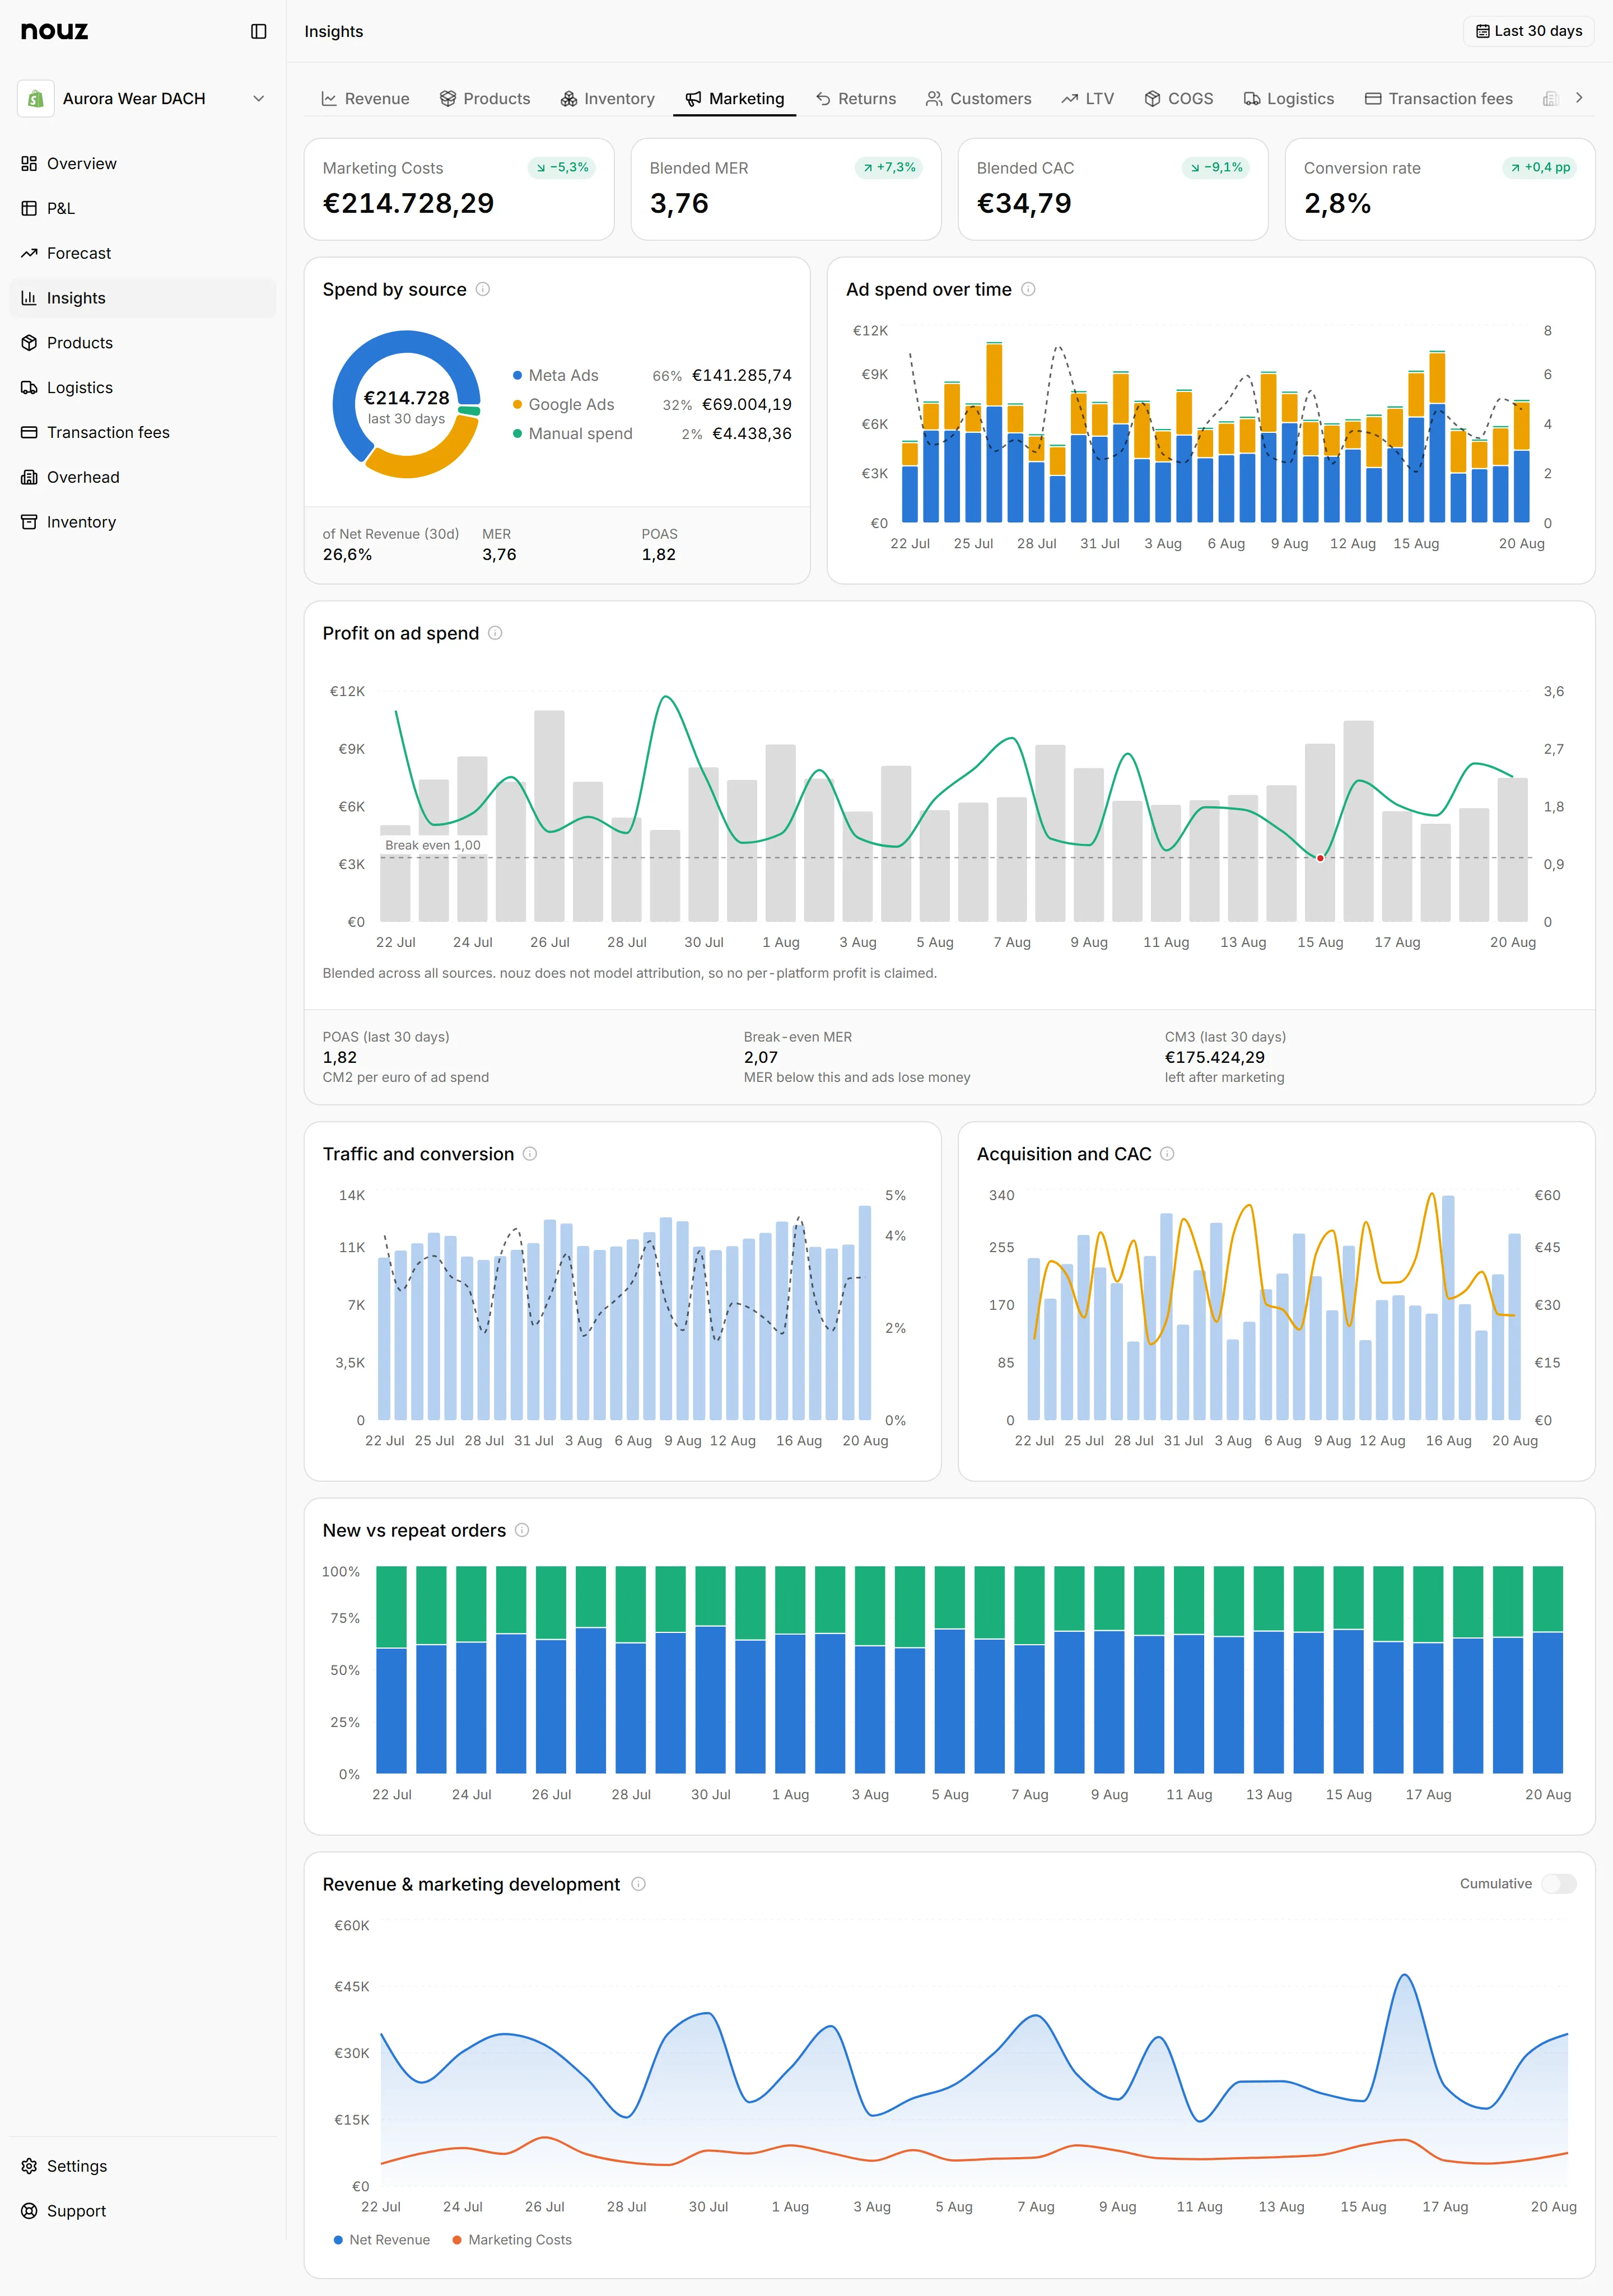
nouz shows it both ways. Insights, Marketing carries the blended break-even MER beside MER and POAS, and Insights, Products gives every product its own Breakeven ROAS and Breakeven ROAS excluding VAT, with the costs below CM1 split to products by what drives them, plus a Breakeven CAC: the most one order of that product can cost to win.
Hold each platform's reported ROAS against the floor for that platform's own purchase value, and judge the whole budget on the blended figure, since the platforms cannot double count what your own books say you took.