- nouz
- Help centre
- Reading your P&L
- How do I compare two periods?
Reading your P&L Answer 3 of 36 Updated
How do I compare two periods?
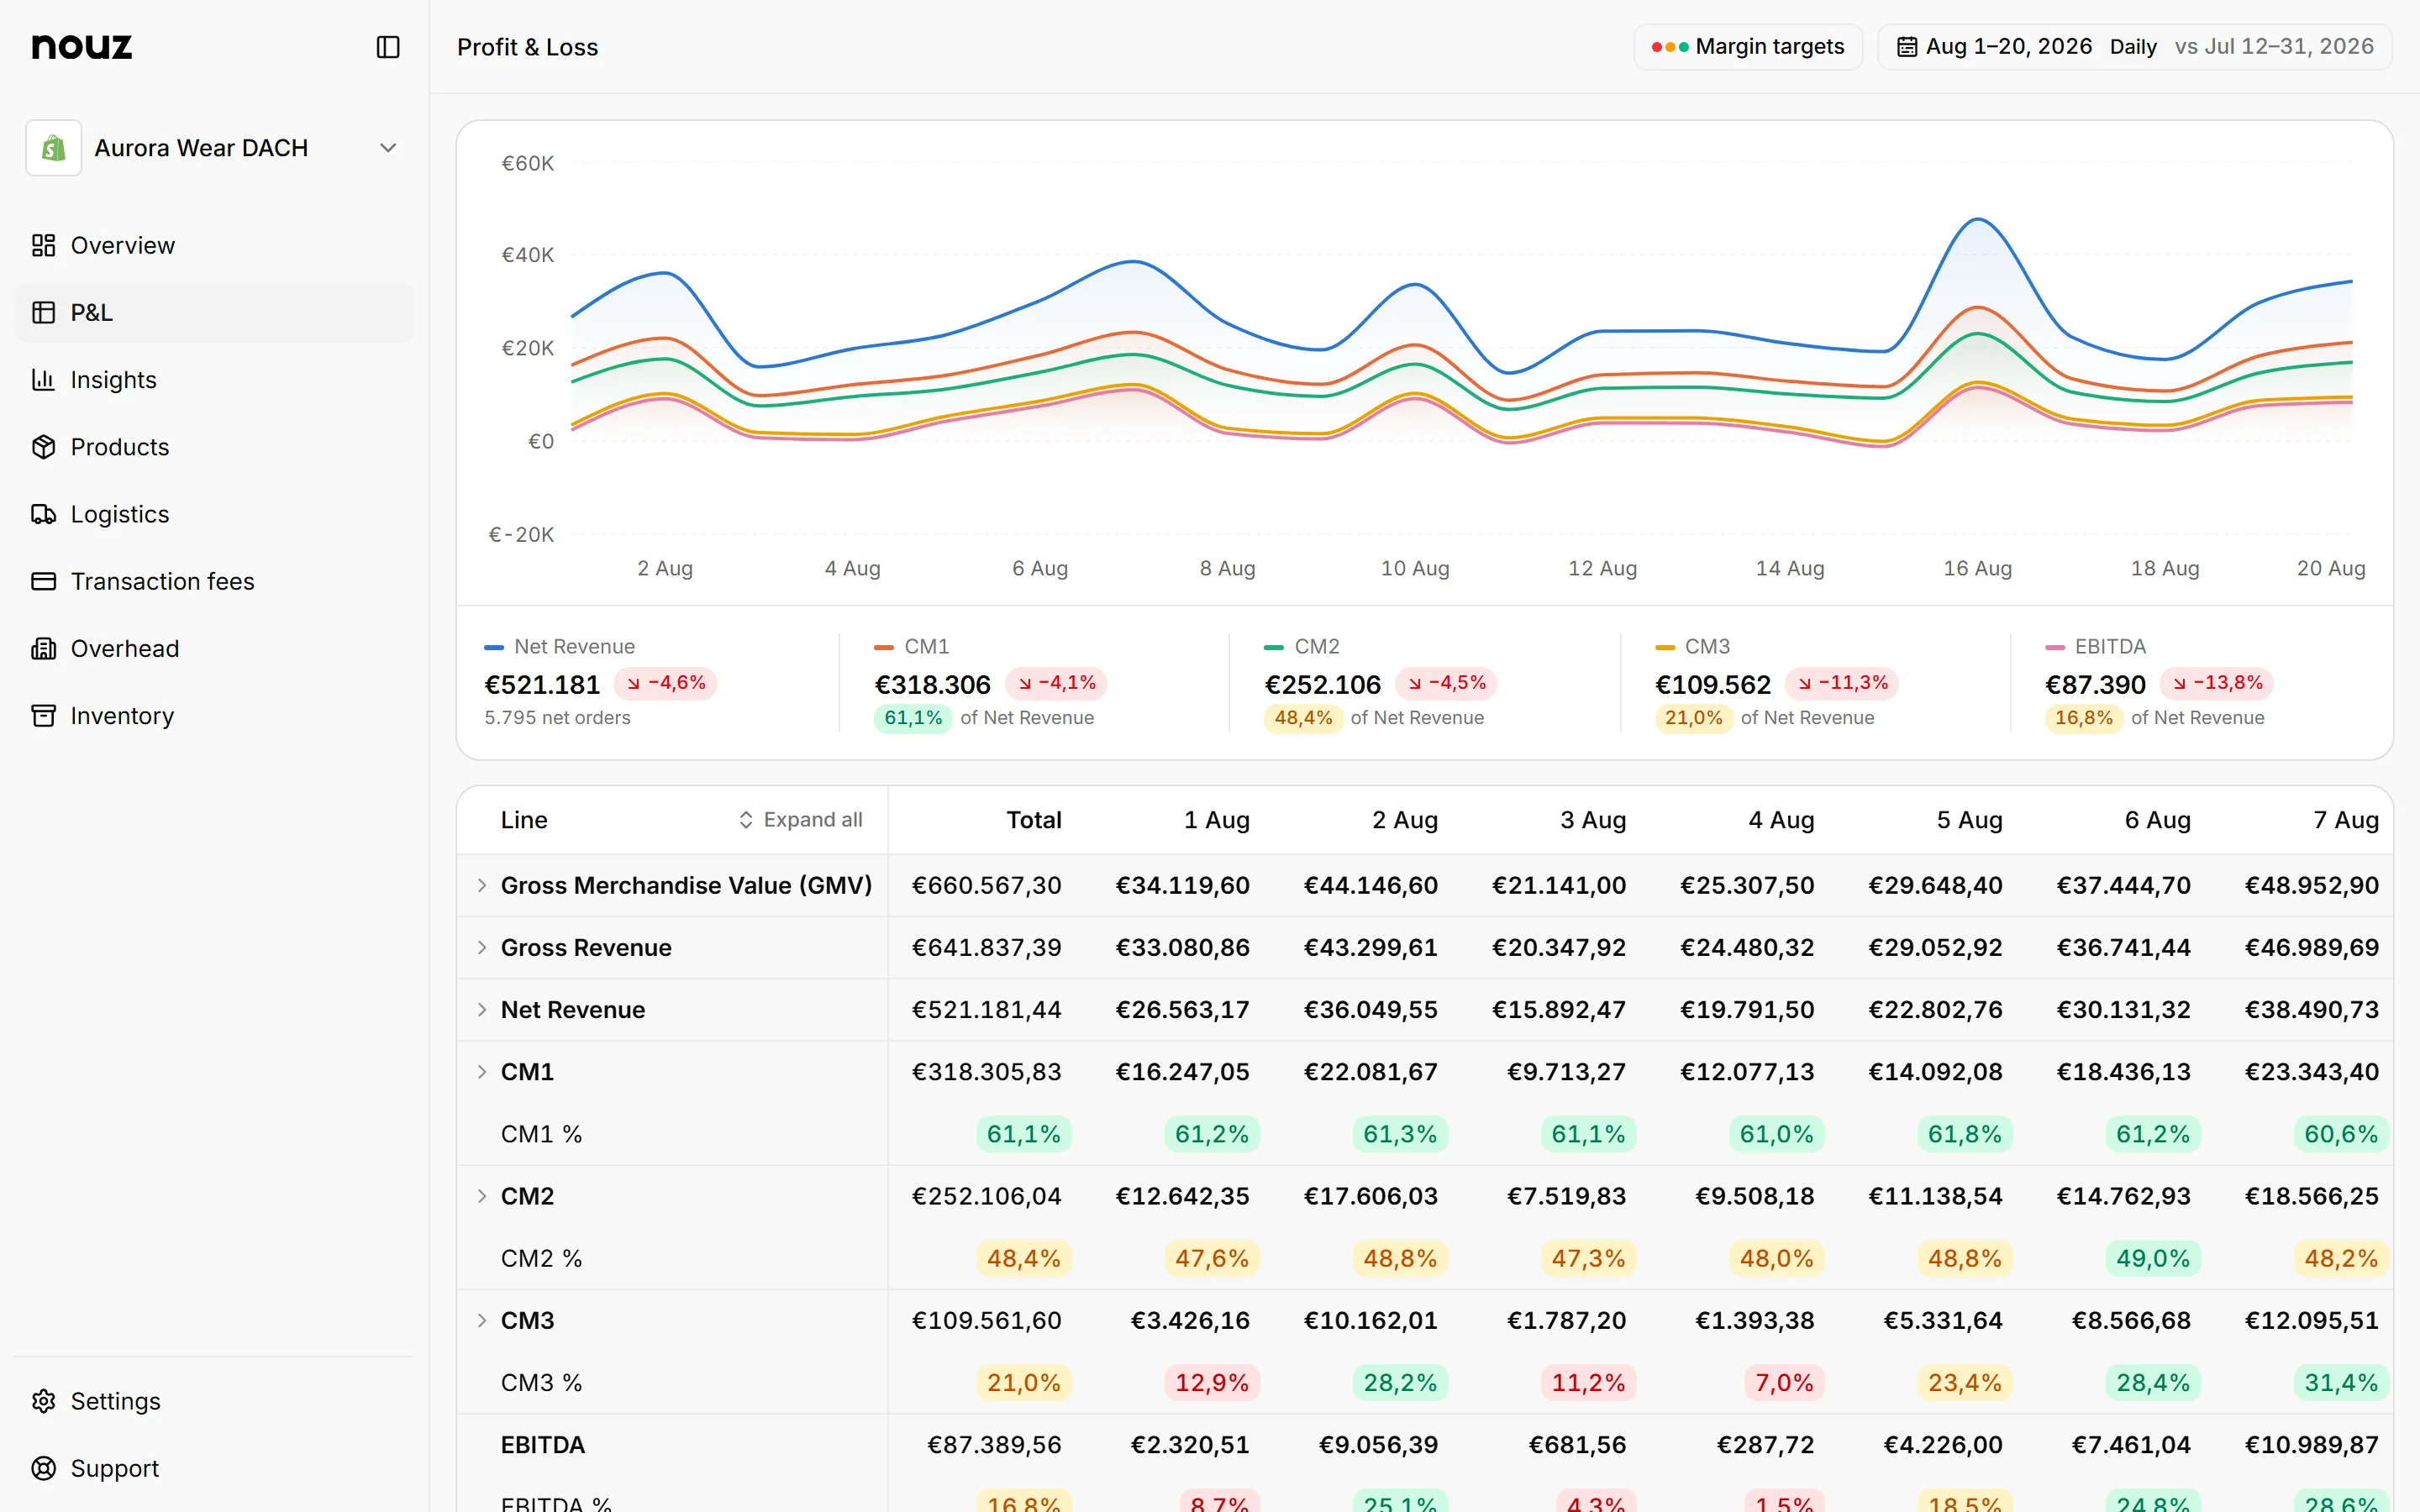
Use the Total view of the P&L, the view it opens on. It puts your range beside the period of the same length just before it. Say you look at 1 to 20 August. The P&L then compares it with 12 to 31 July, which is also 20 days. You set the range in the P&L's range picker.
The table then has four columns: Line, your range, the period before it, and Change. Change shows how much each line moved, like +12,5%. For a percentage line, it shows the difference in points, like +1,2 pp. So going from 20,0% to 21,2% is +1,2 pp. Green means better and red means worse. Grey means it barely moved, or that the line is neither good nor bad, like Taxes.
The strip under the chart at the top of the P&L shows the same comparison for five figures. This KPI strip puts a chip with the change beside each total.
To compare more than two periods, use the Daily, Weekly, Monthly or Yearly view. Those put one column per period, side by side. Either way you compare the same lines, so you can always find the line behind a change.
Where you find it P&L · daily columns
Was this answer helpful?
More in Reading your P&L
All 36 questions- 01 What are CM1, CM2 and CM3?
- 02 What does each line of the P&L mean?
- 03 How do I compare two periods? You are reading this
- 04 What do the Daily, Weekly, Monthly and Yearly views show?
- 05 Can I pick any date range I want?
See what your store really kept yesterday.
Install nouz in minutes from the Shopify App Store. It imports every order your store has ever taken. Cancel anytime.